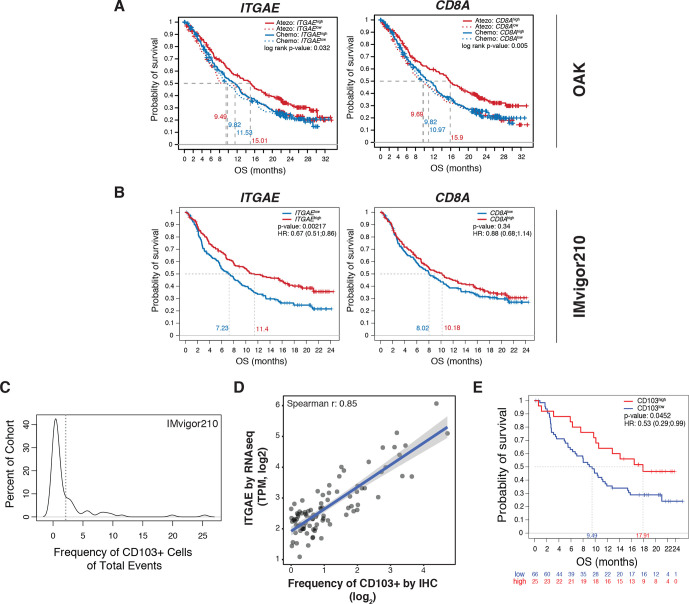
Figure 4.
ITGAE/CD103 expression is predictive of response to PD-L1 blockade. (A) Kaplan-Meier curves depicting the OS probability of patients with locally advanced or metastatic NSCLC cancer treated with atezolizumab (red) or chemotherapy (blue) (OAK) categorized by high (solid line) or low (dotted line) transcriptional expression (median cut-off) of either ITGAE (left panel) or CD8A (right panel). P-values are displayed within each panel. (B) Kaplan-Meier curves demonstrating OS in patients with mUC from IMvigor210 categorized by high (red) or low (blue) transcriptional expression (median cut-off) of either ITGAE (left panel) or CD8A (right panel). HRs and p-values are shown for each gene. (C) Distribution of CD103+ cells in the tumor area across a subcohort (n=91) of IMvigor210 biopsies stained for CD103 by IHC. The dotted line indicates the 2% cut-off defining CD103high and CD103low patient groups. (D) Correlation of gene expression of ITGAE, as measured by bulk RNAseq analysis (TPM, y-axis), to quantification of CD103 protein by IHC (frequency of positive events out of total cells in tumor area, x-axis) for the subset of IMvigor210 patient samples analyzed. The Spearman R correlation value is displayed on the graph. (E) Kaplan-Meier curves comparing OS for patients defined as CD103high and CD103low in (C). Statistical significance was determined by Cox proportional hazard modeling. The HR and p-value are displayed within. HR, hazard ratio; IHC, immunohistochemistry; mUC, metastatic urothelial carcinoma; NSCLC, non-small cell lung cancer; OS, overall survival; PD-L1, programmed cell death ligand 1; RNAseq, RNA sequencing; TPM, transcripts per million.

