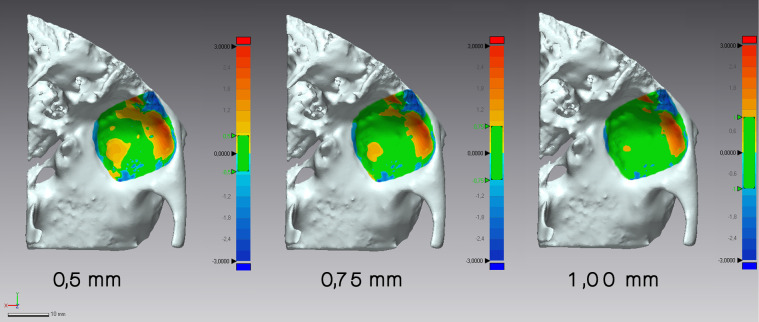
Figure 3.
The surface-to-surface matching technique shows the deviation between the two glenoid fossa specular models previously superimposed. The values included in the tolerance range are graphically represented in green, while the ones exceeding this range are shown in blue (for negative values) or red (for positive values).

