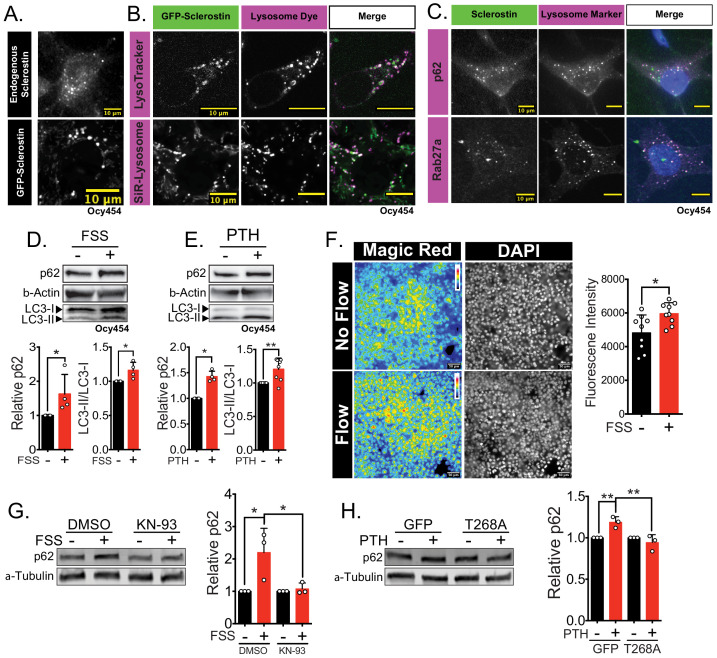
Figure 4. Sclerostin co-localizes with lysosomal markers, and both FSS and PTH induce lysosome activation through CaMKII.
(A) Endogenous sclerostin (top) and GFP-tagged sclerostin (bottom) form discrete puncta in Ocy454 cells. (B) Ocy454 cells were transfected with GFP-sclerostin, and lysosomes were visualized with Lysotracker (1 mM, 1 hr) or siR-Lysosome (1 μM, 4 hr). Scale bar represents 10 μm. (C) Ocy454 cells were stained for endogenous sclerostin and either p62/sequestosome-1 or Rab27a to evaluate co-localization with these lysosome-associated proteins. (D) Ocy454 cells were exposed to 1 min of FSS at 4 dynes/cm2, lysed immediately post-flow, and western blotted for p62/sequestosome-1, β-actin, and LC3 (n = 4). (E) Ocy454 cells were treated with PTH (1–34) (10 nM) for 5 min, lysed, and western blotted for p62/sequestosome-1 and β-actin (n = 4) and LC3 (n = 8). (F) UMR106 cells were subjected to FSS for 5 min, then Magic Red Cathepsin B was applied for 10 min, fixed, and imaged to assess lysosome activity (n = 9). (G) Ocy454 cells were treated with DMSO or KN-93 (10 μM) to inhibit CaMKII for 1 hr prior to FSS at 4 dynes/cm2 for 5 min before lysing immediately after FSS. Western blots were probed for p62/sequestosome-1 and β-actin (n = 3). (H) Ocy454 cells were transfected with a plasmid expressing either GFP or dominant negative CaMKII T286A prior to treatment with PTH (1–34) (10 nM) for 30 min. Western blots were probed for p62/sequestosome-1 and β-actin (n = 3). Graphs depict mean ± SD. *p<0.05, **p<0.01 by unpaired two-tailed t-test (D–F) or by two-way ANOVA with Holm–Sidak post hoc correction (G, H).
Figure 4—figure supplement 1. Co-localization of sclerostin with lysosomes.


