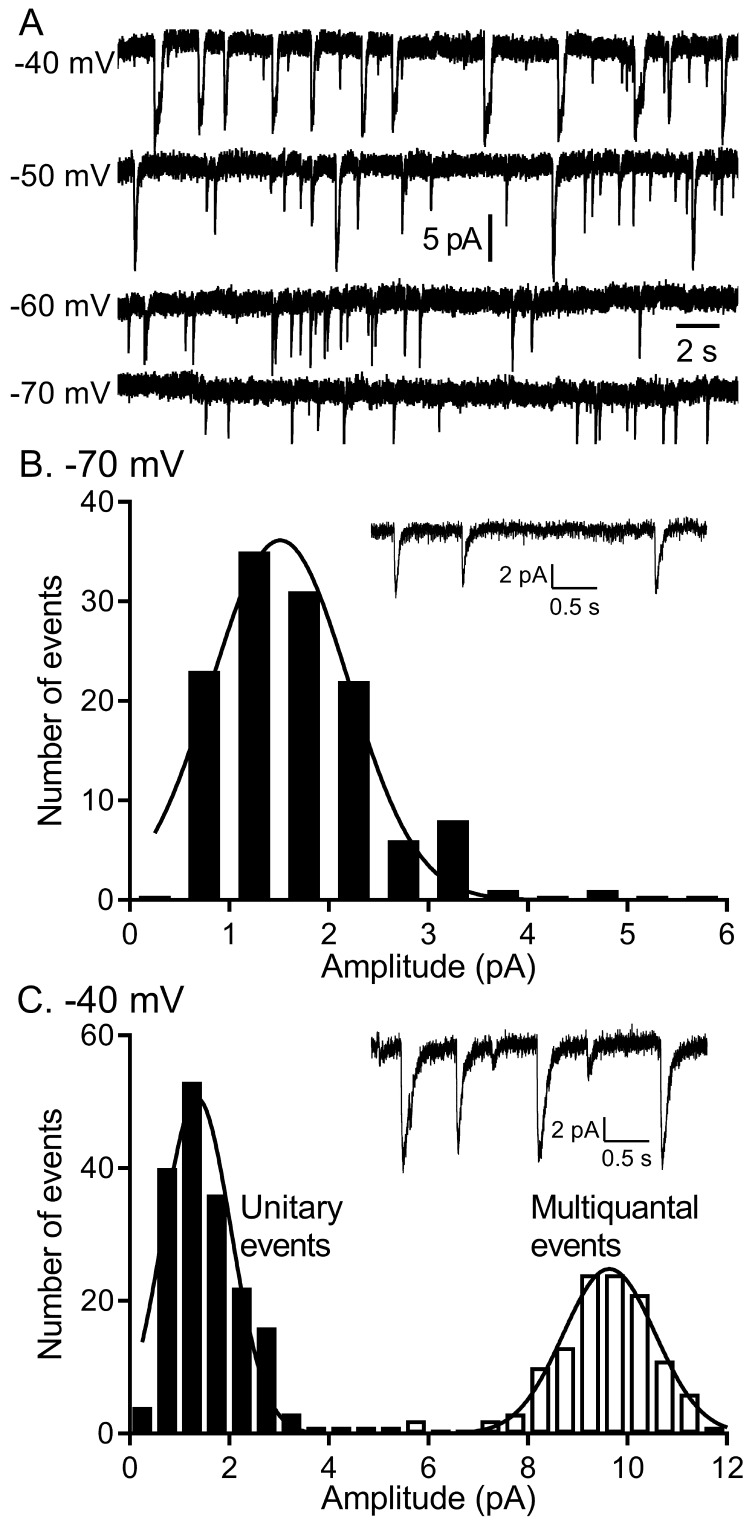
Figure 1. The quantity of glutamate released measured by IA(glu) increased with depolarization but near −40 mv, release shifted from single vesicle fusion events to multivesicular release events consisting of 10–20 vesicles apiece.
(A) Representative traces from a single rod clamped at various voltages. (B) Example recording and amplitude histogram of unitary IA(glu) events from a rod voltage-clamped at −70 mV. Amplitude histogram was fit with a Gaussian function (mean ± SD = 1.51 ± 0.688 pA; n = 127 events). (C) Example recording and amplitude histogram from the same rod held at −40 mV. Amplitude histograms for unitary (black bars) and multivesicular (open bars) events were each fit with Gaussian functions (mean unitary event amplitude = 1.35 ± 0.685 pA; n = 178 events; multiquantal event amplitude = 9.64 ± 0.924 pA, n = 118 events).

