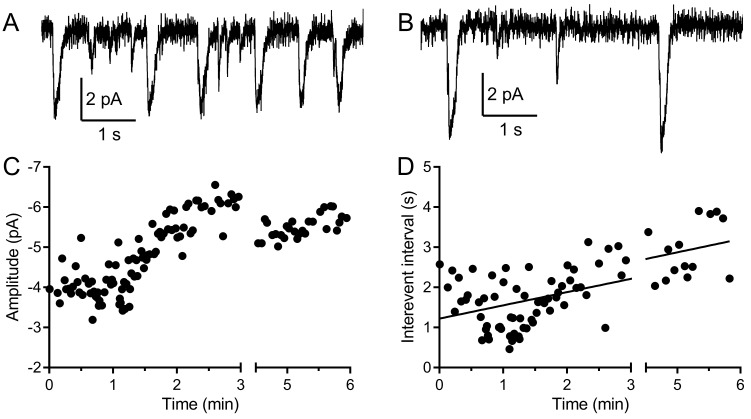
Figure 3. Multivesicular events increased in amplitude and declined in frequency during recording.
(A, B) Example traces recorded from the same rod held at −40 mV during the first minute (A) and after 5 min (B). (C) The amplitude of multivesicular events as a function of time during the recording. (D) The intervals between multivesicular events as a function of time (room temperature). The plot of intervals (s) as a function of time after patch rupture (min) was fit with a linear regression (y-intercept = 1.22 s, slope = 0.33 s/min, R2 = 0.42, n = 123 intervals).

