. 2021 Feb 24;10:e60321. doi: 10.7554/eLife.60321

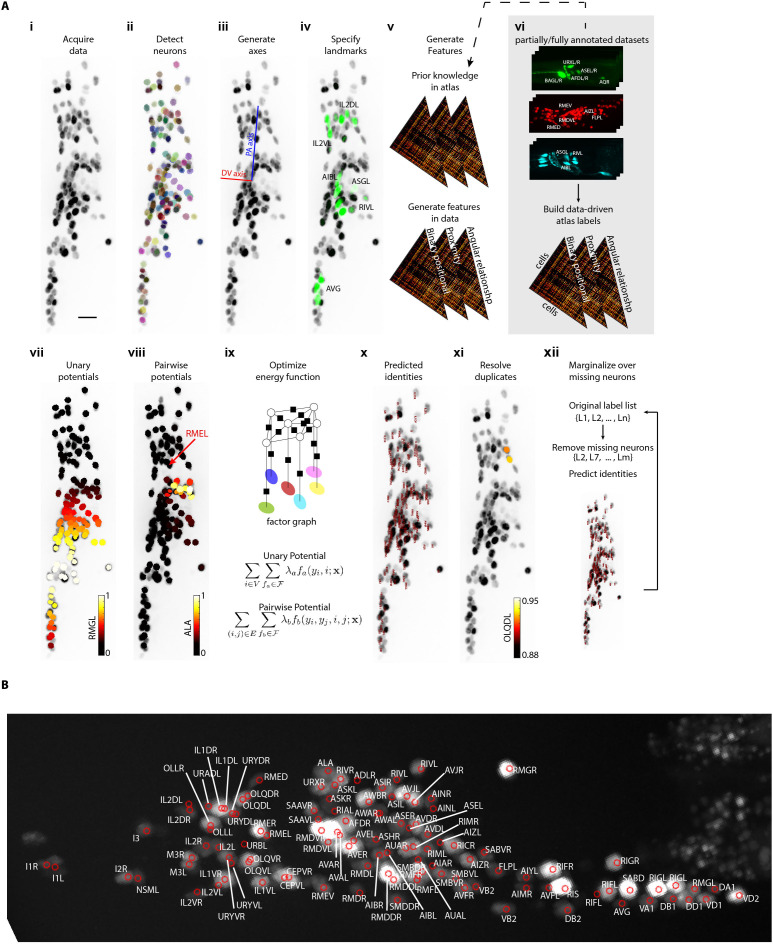
Figure 1. CRF_ID annotation framework automatically predicts cell identities in image stacks.

(A) Steps in CRF_ID framework applied to neuron imaging in C. elegans. (i) Max-projection of a 3D image stack showing head ganglion neurons whose biological names (identities) are to be determined. (ii) Automatically detected cells (Materials and methods) shown as overlaid colored regions on the raw image. (iii) Coordinate axes are generated automatically (Note S1). (iv) Identities of landmark cells if available are specified. (v) Unary and pairwise positional relationship features are calculated in data. These features are compared against same features in atlas. (vi) Atlas can be easily built from fully or partially annotated dataset from various sources using the tools provided with framework. (vii) An example of unary potentials showing the affinity of each cell taking the label RMGL. (viii) An example of dependencies encoded by pairwise potentials, showing the affinity of each cell taking the label ALA given the arrow-pointed cell is assigned the label RMEL. (ix) Identities are predicted by simultaneous optimization of all potentials such that assigned labels maximally preserve the empirical knowledge available from atlases. (x) Predicted identities. (xi) Duplicate assignment of labels is handled using a label consistency score calculated for each cell (Appendix 1–Extended methods S1). (xii) The process is repeated with different combinations of missing cells to marginalize over missing cells (Note S1). Finally, top candidate label list is generated for each cell. (B) An example of automatically predicted identities (top picks) for each cell.

Figure 1.

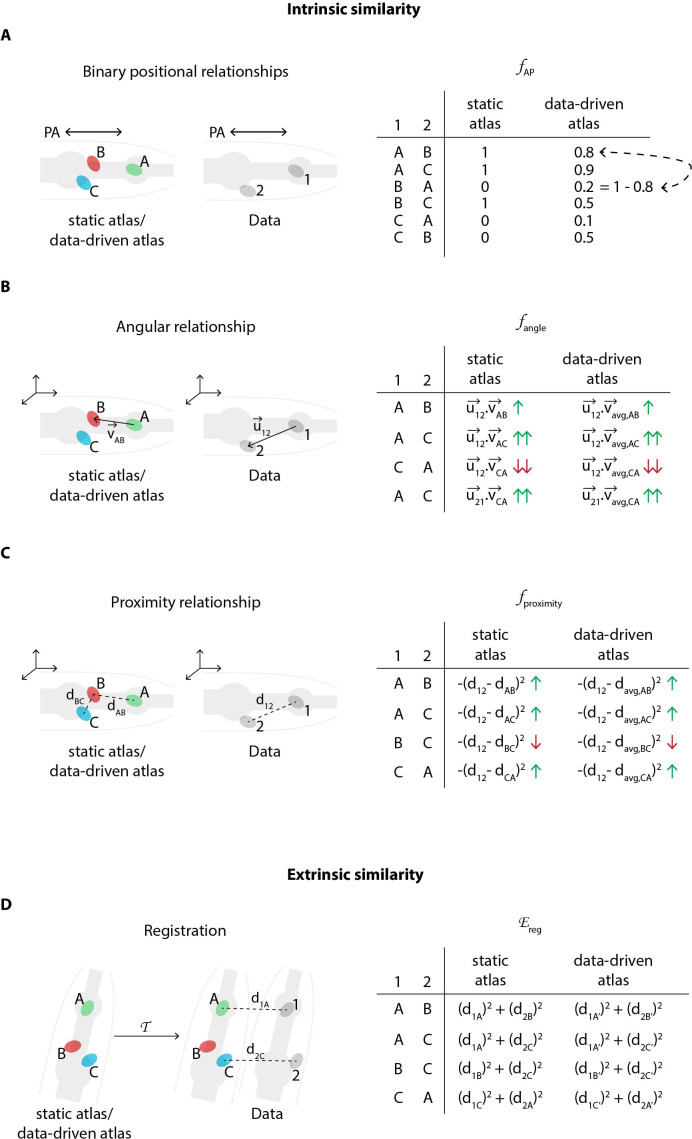
Figure 1—figure supplement 1. Schematic description of various features in the CRF model that relate to intrinsic similarity and extrinsic similarity.

Figure 1—figure supplement 1.

(A) An example of binary positional relationship feature (Appendix 1–Extended methods S1.2.2) illustrated for positional relationships along AP axis. The table lists feature value for some exemplary assignment of labels ‘A’, ‘B’, and ‘C’ from the atlas to cells ‘1’ and ‘2’ in the image data. For example since cell ‘1’ is anterior to cell ‘2’ in image, if labels assigned to these cells are consistent with the anterior-posterior positional relationship (e.g. ‘A-B’, ‘A-C’, ‘B-C’), then the feature value is high (1); else low (0). CRF_ID model assigns identities to cells in image by maximizing the feature values for each pair of cells in image over all possible label assignments. The table also illustrates the difference between using a static atlas (or single data source) and a data-driven atlas built using available annotated data. In case of static atlas, the CRF model assumes that the cell ‘A’ is anterior to cell ‘B’ with 100% probability. In contrast, in experimental data cell ‘A’ may be anterior to cell ‘B’ with 80% probability (8 out of 10 datasets) and cell ‘B’ may be anterior to cell ‘C’ with 50% probability (5 out of 10 datasets). Thus, data-driven atlases relaxes the hard constraint and uses statistics from experimental data. The feature values are changed accordingly. Note, unlike registration based methods for building data-driven atlas, in CRF model data-driven atlases record only probabilistic positional relationship among cells and not probabilistic positions of cells. Thus CRF_ID does not build spatial atlas of cells. (B) An example of angular relationship feature (Appendix 1–Extended methods S1.2.4). The table lists feature value for some exemplary assignment of labels. For example, the feature value is highest for assigning labels ‘A’ and ‘C’ to cells ‘1’ and ‘2’’ because the vector joining cells ‘A’ and ‘C’ in atlas (vAC) is most directionally similar to vector joining cells ‘1’ and ‘2’ in image (u12) as measured by dot product of vectors. For data-driven atlas, average vectors in atlas are used. (C) An example of proximity relationship feature (Appendix 1–Extended methods S1.2.3). The table lists feature value for some exemplary assignment of labels. For example, the feature value is low for assigning labels ‘B’ and ‘C’ to cells ‘1’ and ‘2’’ because the distance between cells ‘B’ and ‘C’ in atlas (dBC) is least similar to distance between cells ‘1’ and ‘2’ in image (d12). The distance metric can be Euclidean distance or geodesic distance. For data-driven atlas, average distances in atlas are used. (D) An example illustrating the cell annotation performed by maximizing extrinsic similarity in contrast to intrinsic similarity. Registration based methods maximize extrinsic similarity by minimizing registration cost function reg. Here, a transformation 𝒯 is applied to the atlas and labels are annotated to cells in image by minimizing the assignment cost that is sum of distances between cell coordinates in image and transformed coordinates of cells in atlas. For data-driven atlas, a spatial atlas is built using annotated data that is used for registration. Note, in contrast, CRF_ID method does not build any spatial atlas of cells because it uses intrinsic similarity features. CRF_ID only builds atlases of intrinsic similarity features shown in panels (A-C).
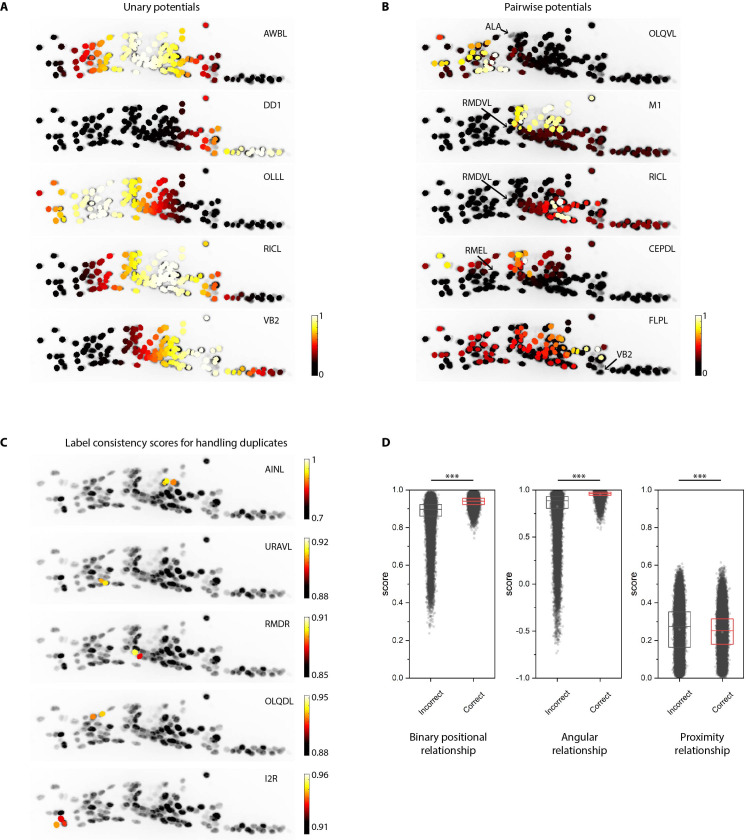
Figure 1—figure supplement 2. Additional examples of unary and pairwise potentials and label consistency scores calculated for each cell.

Figure 1—figure supplement 2.

(A) Unary potentials encode affinities of each cell to take specific labels in atlas. Here, affinities of all cells to take the label specified on the top right corner of images are shown. Randomly selected examples are shown here. In practice, unary potentials are calculated for all cells for every label. (B) Pairwise potentials encode affinities of pair of cells in head ganglion to get two labels from atlas. Here, we show the affinity of all cells taking the label specified on the top right corner of images given the cell marked by the arrow is assigned the given label. Randomly selected examples are shown here. In practice, pairwise potentials are calculated for all pairs of cells for all pairs of labels. (C) Examples of label-consistency score of cells that were assigned duplicate labels (specified on the top right corner of the image) in an intermediate step in framework. To remove duplicate assignments, only the cell with the highest consistency score is assigned the label. Optimization is run again to assign labels to all unlabeled cells while keeping the identities of labeled cells fixed. (D) Comparison of label-consistency scores for accurately predicted cells and incorrectly predicted cells. Correctly predicted cells have a higher binary positional relationship consistency score, close to one angular relationship consistency score (smaller angular deviation between labels in image and atlas) and close to 0 proximity consistency score (smaller Gromov-Wasserstein discrepancy). Scores shown for all 130 predicted cells in synthetic data across ~1100 runs. Thus, n ≈ 150,000. *** denotes p<0.001, Bonferroni paired comparison test. Each run differed from the other in terms of random position noise and count noise applied to synthetic data to mimic real images. Top, middle, and bottom lines in box plot indicate 75th percentile, median, and 25th percentile of data, respectively.
Figure 1—video 1. Identities predicted automatically by the CRF_ID framework in head ganglion stack.
Download video file (531.4KB, mp4)
Top five identities predicted are shown sorted by consistency score. Scale bar 5 µm.