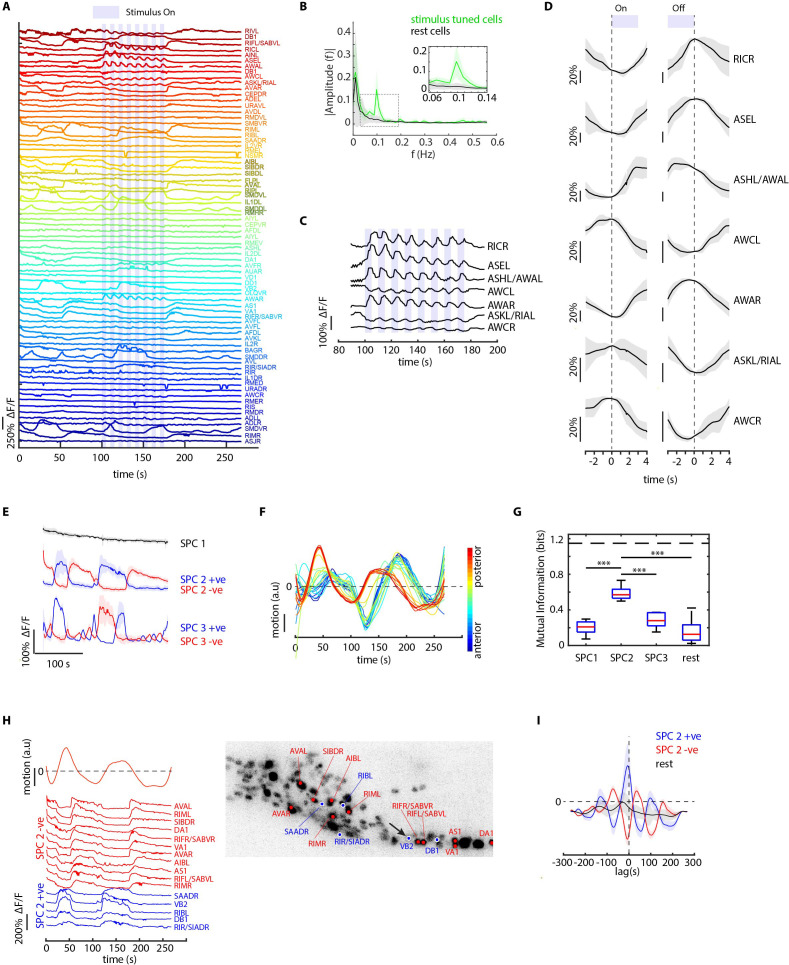
Figure 5. CRF_ID framework identifies neurons representing sensory and motor activities in whole-brain recording.
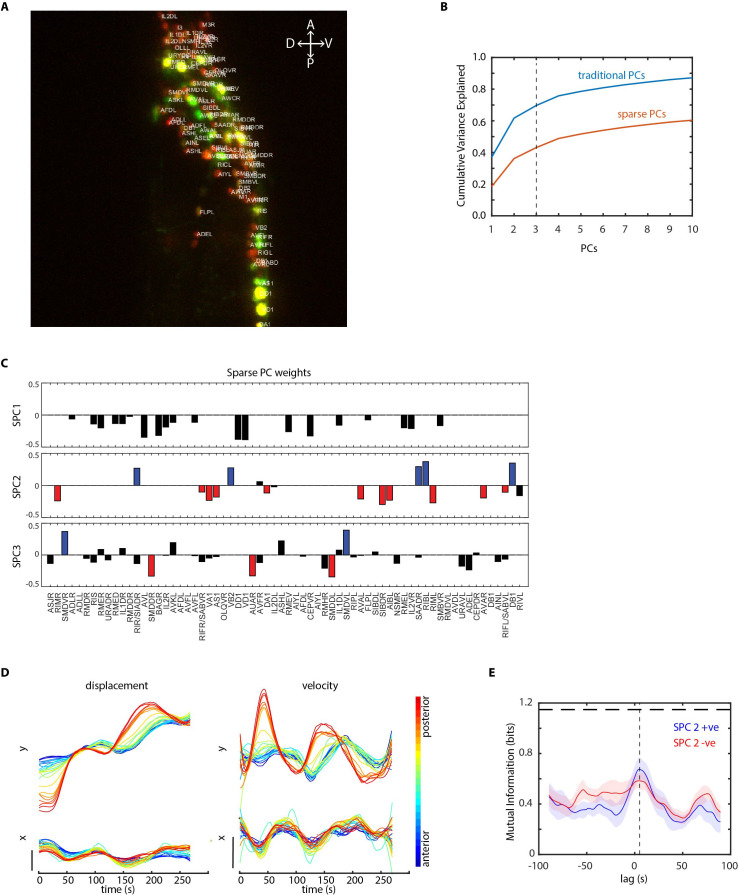
(A) GCaMP6s activity traces of 73 cells automatically tracked throughout a 278 s long whole-brain recording and the corresponding predicted identities (top labels). Periodic stimulus (5 sec-on – 5 sec-off) of bacteria (E. coli OP50) supernatant was applied starting at 100 s (shaded blue regions). Experimental data comes from strain GT296. (B) Power spectrum of neuron activity traces during the stimulation period for all cells. Cells entrained by 0.1 Hz periodic stimulus show significant amplitude for 0.1 Hz frequency component (green). (C) Activity traces of cells entrained by periodic stimulus shown for the stimulation period. Blue shaded regions indicate stimulus ON, unshaded region indicate stimulus OFF. Identities predicted by the framework are labeled. (D) Average ON and OFF responses of cells entrained by periodic stimulus across trials. The black line indicates mean and gray shading indicates ± s.e.m. (E) Average activities of neurons with significant non-zeros weights in the first three sparse principal components (SPCs). Activities within each component are stereotypical and different components show distinct temporal dynamics. Cells with positive weights (blue) and negative weights (red) in SPC2 and SPC3 showed anti-correlated activity. Out of the 67 non-stimulus-tuned cells, 19 had non-zero weights in SPC1, 16 cells had non-zero weights in SPC2, and 5 cells had non-zero weights in SPC3. SPC1, SPC2, and SPC3 weights of cells are shown in Figure 5—figure supplement 1. Shading indicates mean ± s.e.m of activity. (F) Velocity (motion/second) traces of cells along anterior-posterior (AP) axis (blue to red) show phase shift in velocity indicating motion in device shows signatures of wave propagation. (G) Cells with non-zero weights in SPC2 show high mutual information with worm velocity compared to cells grouped in other SPCs (*** denotes p<0.001, Bonferroni paired comparison test). Median (red line), 25th and 75th percentiles (box) and range (whiskers). Dashed line indicates entropy of velocity (maximum limit of mutual information between velocity and any random variable). Velocity of cell indicated by the black arrow in panel H right was used for mutual information analysis. (H) Activity traces of 16 cells (with significant non-zero weights) in SPC2 and corresponding identities predicted by the framework. Red traces for cells with negative weights in SPC2, blue traces for cells with positive weights in SPC2. Worm motion/second shown on top. (Right) max projection of 3D image stack showing head ganglion neurons and cells with positive weights (blue) and negative weights (red) in SPC2. Motion/second of cell indicated with arrow is shown in left panel. (I) Cross-correlation analysis between velocity and cells with non-zero weights in SPC2 shows a strong correlation between neuron activities and velocity. In comparison, other cells show low correlation. Velocity of cell indicated by arrow in panel H right was used for cross-correlation analysis.


