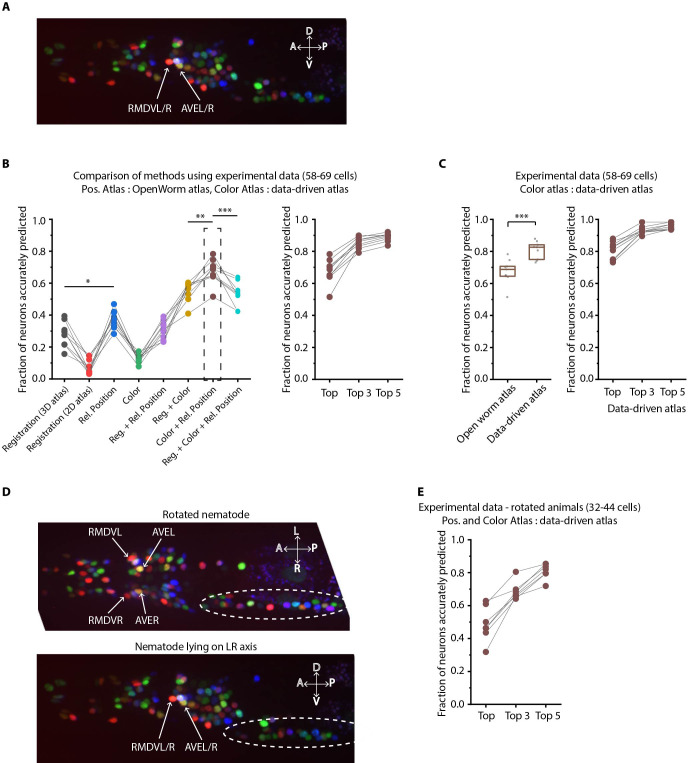
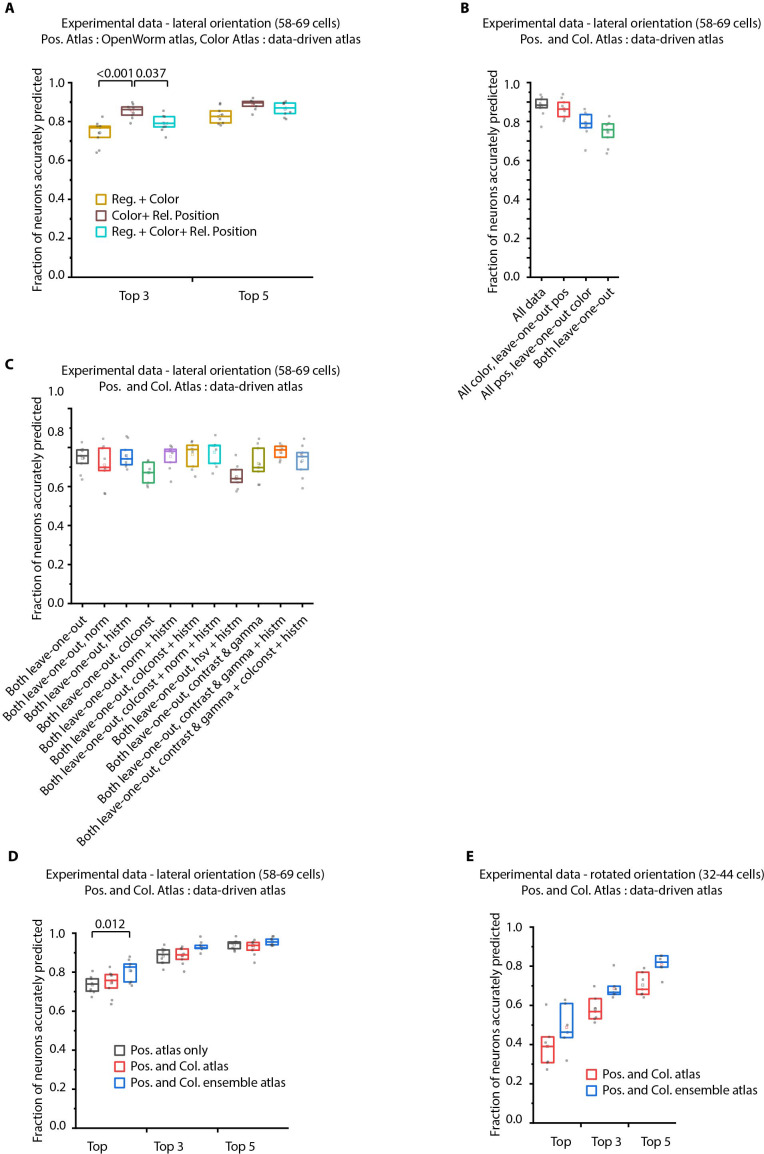
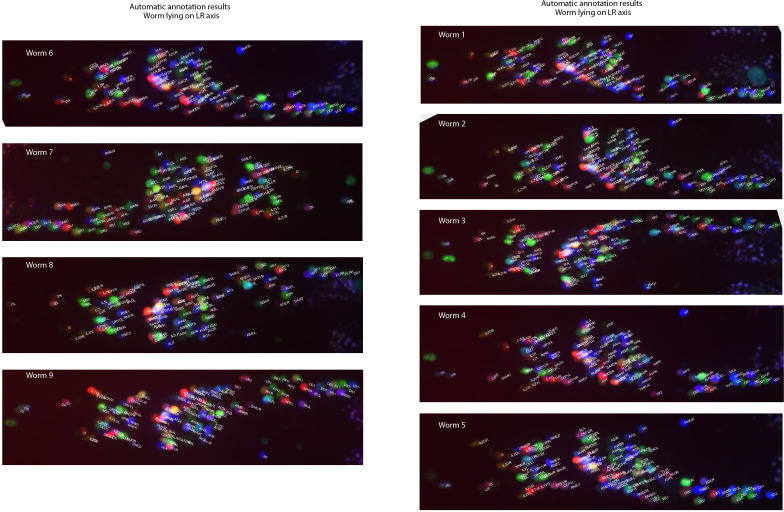
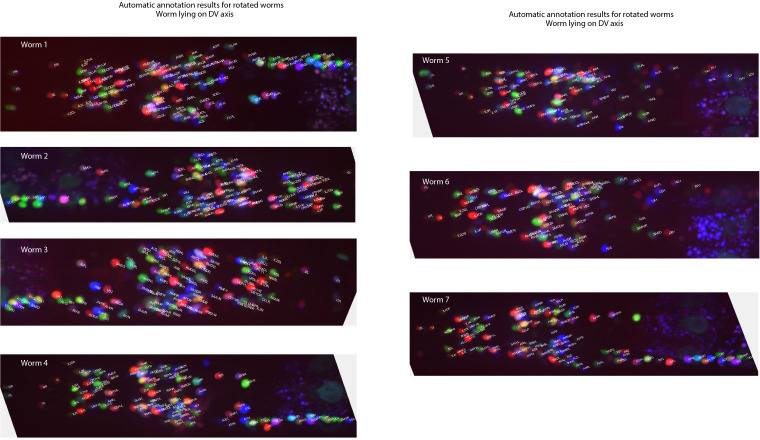
Figure 6. Annotation framework is generalizable and compatible with different strains and imaging scenarios.
(A) A representative image (max-projection of 3D stack) of head ganglion neurons in NeuroPAL strain OH15495. (B) (Left) comparison of prediction accuracy for various methods that use different information. CRF_ID framework that combines relative position features along with color information performs best (n = 9 animals, *p<0.05, **p<0.01, ***p<0.001, Bonferroni paired comparison test). (Right) the best performing method predicts cell identities with high accuracy. OpenWorm static atlas was used for all methods. Color atlas was built using experimental data with test data held out. Ensemble of color atlases that combine two different color matching methods were used for prediction. Accuracy results shown for top predicted labels. Experimental data comes from strain OH15495. (C) (Left) annotation framework can easily incorporate information from annotated data in the form of data-driven atlas, which improves prediction accuracy (***p<0.001, Bonferroni paired comparison test). Prediction was performed using leave-one-out data-driven atlases for both positional relationship features and color. Accuracy shown for top predicted labels. Ensemble of color atlases that combine two different color matching methods were used for prediction. (Right) accuracy achieved by top, top 3, and top 5 labels. Experimental data comes from strain OH15495. Top, middle, and bottom lines in box plot indicate 75th percentile, median and 25th percentile of data, respectively. (D) An example image of head ganglion neurons in NeuroPAL strain for rotated animal (nematode lying on DV axis). In contrast, animal lying on the LR axis is shown below. The locations of RMDVL/R, AVEL/R cells in the two images are highlighted for contrasts. Dashed ellipses indicate positions of cells in retrovesicular ganglion, showing that the rotated animal is not rigidly rotated. Experimental data comes from strain OH15495. (E) Top-label prediction accuracies for non-rigidly rotated animal. n = 7 animals. Experimental data comes from strain OH15495 and OH15500. Prediction was performed using leave-one-out data-driven atlases for both positional relationship features and color. Accuracy shown for top predicted labels. Ensemble of color atlases that combine two different color matching methods were used for prediction.


