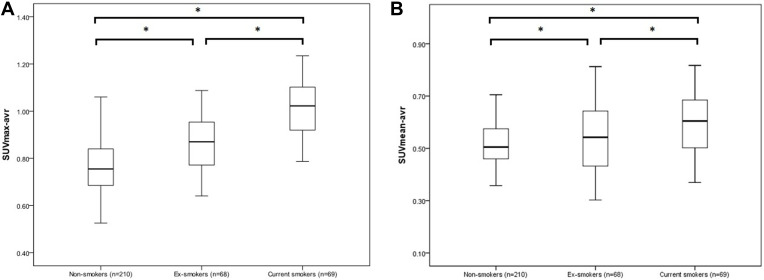
Figure 2.
Differences in SUVmax-avr (A) and SUVmean-avr (B) between non-smokers, ex-smokers, and current smokers. The data are presented as box plots (median, interquartile range, range). *P< 0. 05 (two-tailed unpaired t-test). SUVmax-avr, the average of maximum SUVs, and SUVmean-avr, the average of mean SUVs, were measured in the RUL, RLL, LUL, and LLL.

