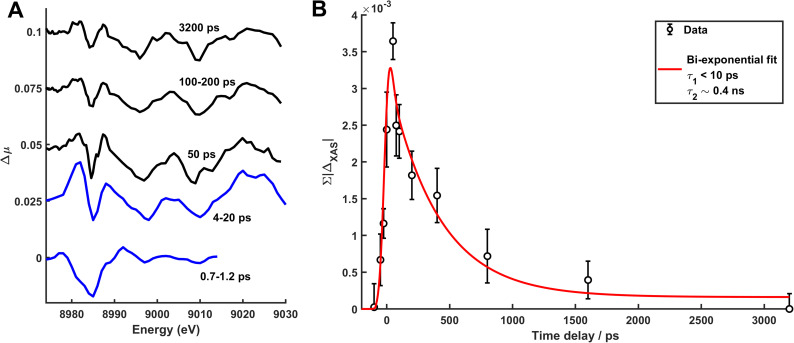
FIG. 6.
(a) Δμ-difference signals (second order Savitzky–Golay filtered) for Cu-edge XAS offset by 0.025 between each difference signal. Black and blue lines indicate data taken at APS and SACLA, respectively. At SACLA, only data <9015 eV were acquired at the shortest time delays. (b) Time evolution of absolute sum of the Cu-edge Δμ difference signal in the range of 8929–9029 eV (black points) and a bi-exponential fit (red line).

