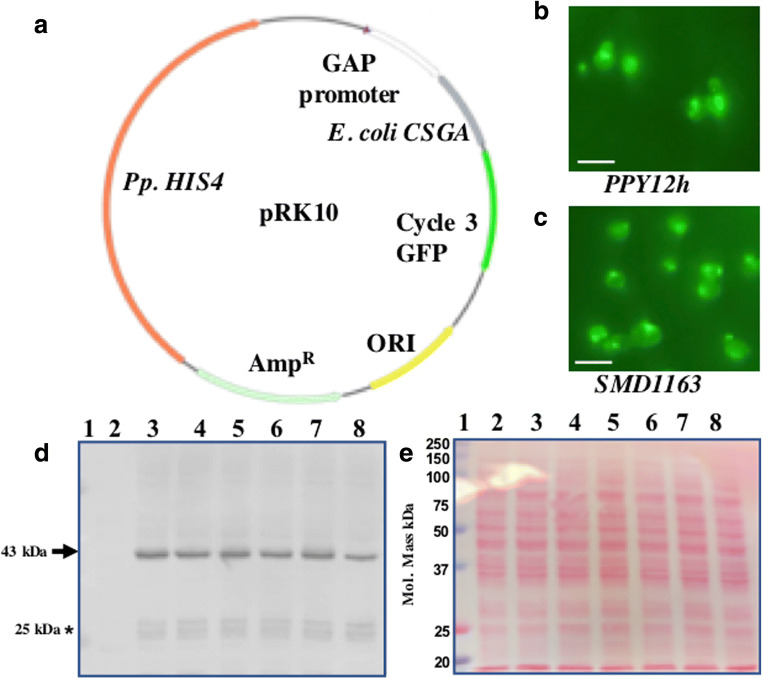
Fig. 1.
Expression of E. coli CSGA-GFP fusion protein in K. phaffii. (A) Map of the final plasmid used for expression of the CSGA-GFP fusion protein. Expression of a CSGA-GFP fusion protein in (B) PPY12h and (C) SMD1163 strain. Scale bar represents 5 uM. (D) Image of western blot showing expression of the CSGA-GFP fusion protein in PPY12h. Bands of interest are pointed by arrows towards them while free GFP is pointed by an Asterisk mark. (E) Proper loading and protein transfer are shown by Ponceau S-stained blot image. Well, 1 (pre-stained protein marker), well 2 (empty vector as a negative), well 3-8 (transformants)

