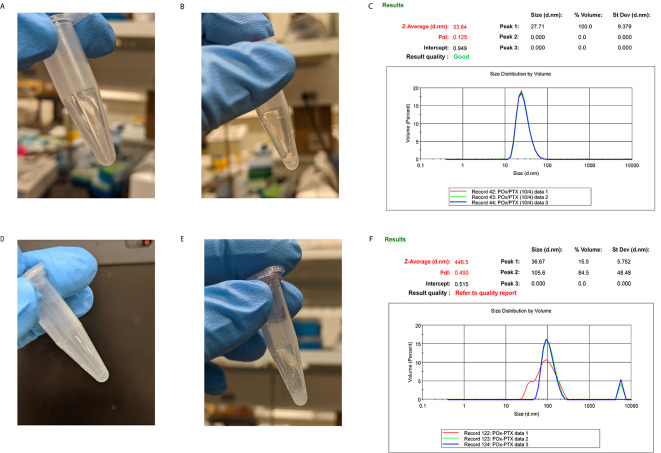
Figure 2. Representative images of the (A, D) thin film, (B, E) hydrated thin film, and (C, F) DLS volume distribution.
The top panel represents drug-incorporated micelles prepared using optimal conditions, as demonstrated by the monodisperse volume distribution with a single peak around 27 nm. The bottom panel is representative of sub-optimal conditions, indicated by the cloudy thin film and the incomplete hydration of the thin film, resulting in polydisperse size distribution with a peak at about 105 nm and a large peak of aggregates in the micrometer range.

