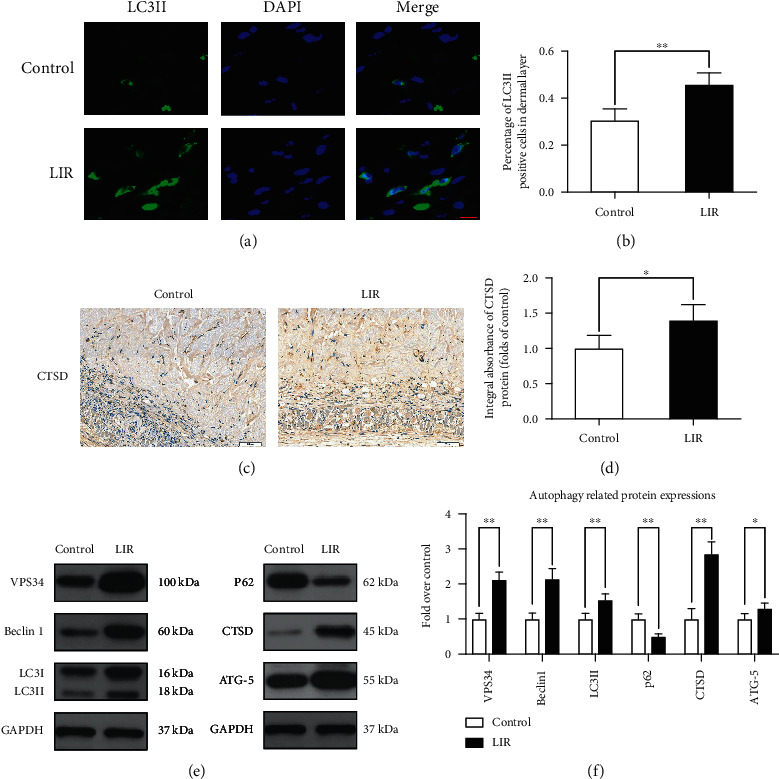
Figure 4.

LIR activates autophagy in random flap tissue. (a) LC3II expression in flap tissues was detected by immunofluorescence analysis, and autophagosomes are shown (green) (scale bar: 10 μm). (b) Histogram of the percent of LC3II-positive cells. (c) Immunohistochemical detection of CTSD expression in each group (magnification: 200x; scale bar: 50 μm). (d) ImageJ was used to quantitatively analyse the CTSD optical density values for each group. (e) Western blot analysis of VPS34, Beclin-1, LC3II, P62, CTSD, and ATG-5. (f) ImageJ was used to quantitatively analyse the optical density values of VPS34, Beclin-1, LC3II, P62, CTSD, and ATG-5 in each group. The data are presented as the means ± standard error, n = 6 for each group. ∗p < 0.05 and ∗∗p < 0.01.
