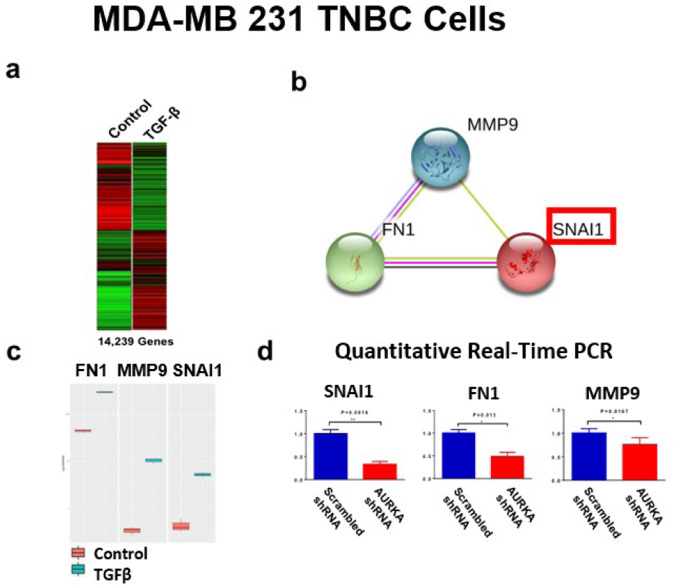
Fig. 4. Transcriptomic analysis of MDA-MB 231 TNBC cells.
a RNA-Seq analysis was performed on MDA-MB 231 cells treated with 10 ng/ml TGF-β1 for 48 h. 14,239 genes were differentially expressed between control and TGF-β1 groups. b STRINGdb software was used to identify a SNAI1/MMP9/FN1 Network. c Quantification analysis showing FN1, MMP9, and SNAI1 expression before and after TGF-β1 treatment. Experiments were performed in triplicate with a p-value < 0.05. d Real-time quantitative RT-PCR to detect SNA1, FN1, and MMP9 gene expression using MDA-MB 231 cells treated with 10 ng/ml TGF-β1 and infected with scrambled Lenti-shRNA or Lenti-shRNA targeting AURKA (Origene) for 48 h. Three independent experiments were performed in triplicate (±S.D. and P-value < 0.05).

