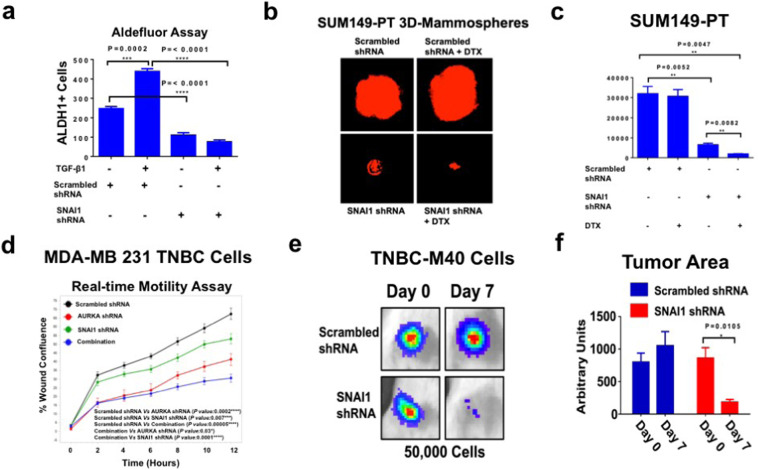
Fig. 5. SNAI1 genetic targeting in TNBC cells.
a BT-549 cells were treated with 10 ng/ml TGF-β1, scrambled lenti-shRNAs and lenti-shRNAs targeting SNAI1. After 48 h incubation, ALDH1 activity was detected with Aldefluor kit and measured by FACS analysis on 10,000 events. ALDH1 inhibitor DEAB was used as the control for each sample. Graph showing the average of ALDH1High cells from three independent experiments (±s.d.). b SUM149-PT cells were cultured under non-adherent conditions for 24 days (three serial passages) to form tertiary MPS. In total, 10,000 cells derived from tertiary MPS were then infected with scrambled or SNAI1 lenti-shRNAs and treated with DMSO (control) or 10 nM DTX for 8 days to monitor MPS growth. MPS were labeled with 5 μM Cell Tracker Red CMTPX (Thermo Fisher Scientific, #C34552) for 1 h and MPS area was measured using the NIH Image-J software. c Graph showing the average of MPS area from three independent experiments (±s.d.). d In total, 12,000 cells infected with scrambled or AURKA and/or SNAI1 lenti-shRNAs were plated on 96-well costar plates and Real-time wound healing assay was performed by using the IncuCyte Instrument. Experiments were performed in triplicate (±s.d.). e In total, 50,000 TNBC-M40 cells infected with Luciferase lenti-vectors and scrambled Lenti-shRNA or SNAI1 scrambled Lenti-shRNA constructs were transplanted into the mammary fat pad of female NSG mice (three animals per group). Tumorigenic capacity was monitored in living animals at 0 (2 h post-injection was used as the control for cell viability) and 7 days post-injection by luciferase imaging. f The tumor Growth Area was quantified using ImageJ-NIH Software and represents the average of three animals per group.

