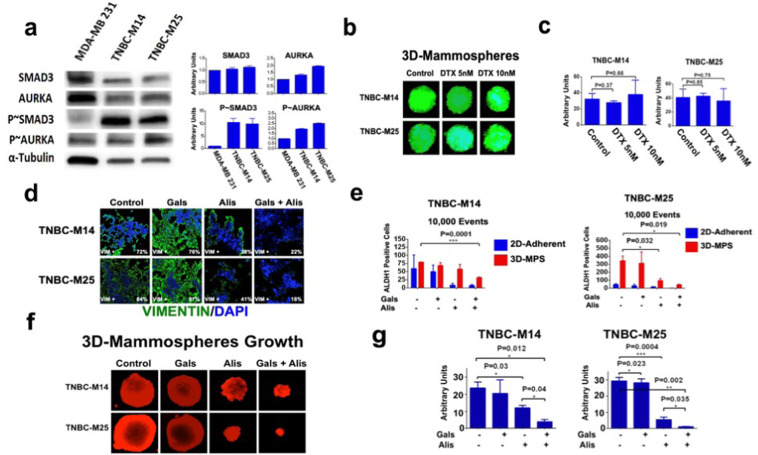
Fig. 7. Dual targeting of TGF-β and AURKA oncogenic pathways inhibits TNBC plasticity.
a Immunoblot analysis showing higher phospho-SMAD3 and phospho-AURKA in TNBC-M14 and TNBC-M25 tertiary MPS compared to MDA-MB 231 used as control. Graphs showing the densitometric quantification of total and phosphoproteins expression normalized to Tubulin. b GFP-tagged TNBC-M14 and TNBC-M25 cells were cultured under non-adherent conditions for 24 days (three serial passages) to form tertiary MPS. In total, 10,000 cells derived from tertiary MPS were then treated with DMSO (control) or DTX for 8 days to monitor MPS growth. MPS area was measured using the NIH Image-J software. c Graph showing the average of MPS area from three independent experiments (±s.d.). d TNBC-M14 and TNBC-M25 cells were treated with 50 nM galunisertib, 50 nM alisertib, and combination for 48 h. Expression and cellular localization of Vimentin (green) was assessed by Immunofluorescence employing the Zeiss Confocal Fluorescent Microscope. Experiments were performed in triplicate with similar results. e Adherent and mammospheres-derived TNBC-M14 and TNBC-M25 were treated with 50 nM galunisertib (Gala), 50 nM alisertib (Alis), and combination. After 48 h incubation, ALDH activity was measured by FACS analysis on 10,000 events. ALDH inhibitor DEAB was used as control. Experiments were performed in triplicate (±s.d.). f TNBC-M14 and TNBC-M25 cells were cultured under non-adherent conditions for 24 days (three serial passages) to form tertiary MPS. In total, 10,000 cells derived from tertiary MPS were then treated with 50 nM galunisertib, 50 nM alisertib, and combination for 8 days. MPS were labeled in red using the CellTracker Red CMTPX Dye. g MPS area was measured using the NIH Image-J software. Experiments were performed in triplicate (±S.D. and P-value < 0.005).

