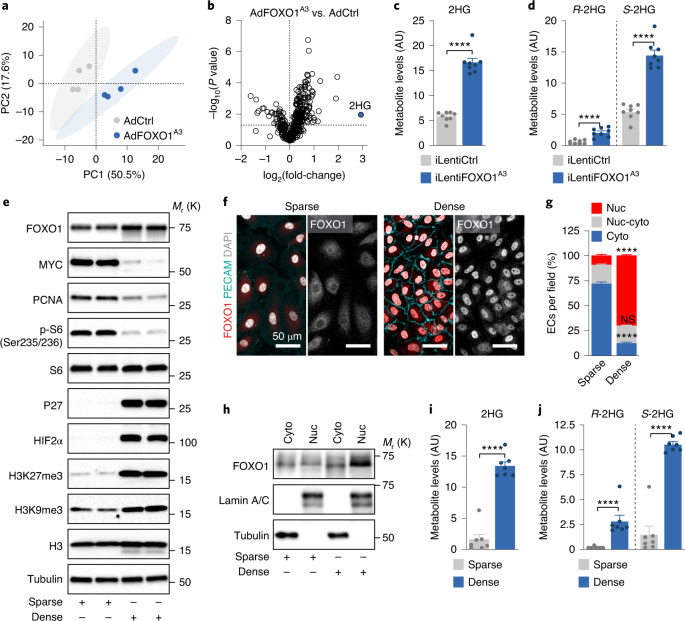
Fig. 1. Activation of FOXO1 signalling induces the generation of S-2HG in ECs.
a, PCA score plot showing distinct metabolic signatures in control (AdCtrl) and FOXO1A3-expressing (AdFOXO1A3) HUVECs (n = 4 independent samples). The percentage variance explained by each principal component (PC) is shown in parentheses. b, Volcano plot of metabolites showing 2HG as the most increased metabolite in FOXO1A3-expressing HUVECs. c, 2HG metabolite levels measured by LC–MS in HUVECs transduced with a doxycycline-inducible control-encoding (iLentiCtrl) or FOXO1A3-encoding (iLentiFOXO1A3) lentivirus (n = 8 independent samples). AU, arbitrary units. d, Chiral derivatization and enantioselective LC–MS measurement of R- and S-2HG levels in HUVECs transduced with iLentiCtrl or iLentiFOXO1A3 (n = 8 independent samples). e, Immunoblot analysis of HUVECs cultured in sparse and dense conditions. HUVECs in dense (contact-inhibited) conditions express markers linked to cellular quiescence. K, 1,000. f,g, Immunofluorescence analysis (f) and quantification (g) of the subcellular localization of FOXO1 (red) in HUVECs cultured in sparse and dense conditions. The isolated FOXO1 signal is shown on the right side of each image in grey (n = 14 (sparse condition) or 8 (dense condition) independent samples). DAPI (grey), nuclei; PECAM (cyan), intercellular endothelial junctions. Cyto, cytoplasmic; Nuc, nuclear; Nuc–cyto, nuclear–cytoplasmic. h, FOXO1 protein levels in cytoplasmic and nuclear fractions isolated from HUVECs cultured under sparse and dense conditions. Lamin A/C and tubulin were used as nuclear and cytoplasmic markers, respectively. i, 2HG metabolite levels in HUVECs cultured in sparse (FOXO1 inactive) and dense (FOXO1 active) culture conditions (n = 7 independent samples). j, Enantioselective LC–MS measurement of R- and S-2HG in sparse and dense HUVEC cultures (n = 7 independent samples). Western blot data in e and h are from the respective experiment, processed in parallel, and are representative of at least three independent experiments. For c, d, g, i and j, data represent the mean ± s.e.m.; two-tailed unpaired t-test, ****P < 0.0001, NS, not significant. The numerical data, unprocessed western blots and P values are provided as source data.

