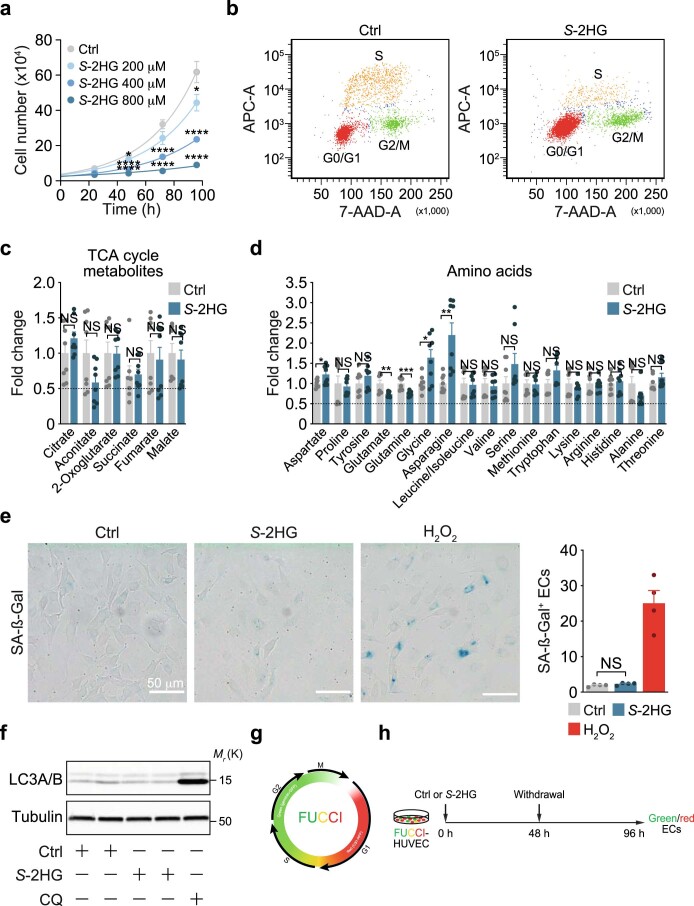
Extended Data Fig. 3. S-2HG is a cell cycle-arresting metabolite.
a, Proliferation curves comparing HUVECs treated with DMSO (Ctrl) or cell-permeable S-2HG, showing a dose-dependent reduction in S-2HG-stimulated HUVECs at the indicated concentrations and time points, (n=10 independent samples). b, Representative flow cytometry density plots showing the cell cycle phase distribution in HUVECs treated with vehicle (Ctrl) or S-2HG for 48 hours. c, Relative abundance of TCA cycle metabolites in Ctrl and S-2HG-treated HUVECs. LC-MS measurements were performed 48h after stimulation, (n=8 independent samples). d, Relative abundance of amino acids in Ctrl and S-2HG-treated HUVECs. LC-MS measurements were performed 48h after stimulation, (n=8 independent samples). e, Representative images and quantification of senescence-associated β-galactosidase (SA-β-Gal) staining showing that S-2HG does not induce cellular senescence. HUVECs were stimulated with DMSO (Ctrl) or S-2HG for 48h. Hydrogen peroxide (H2O2) stimulated cells were used as a positive control, (n=4 independent samples). f, LC3A/B immunoblot analysis showing that S-2HG treatment for 48h does not induce autophagy in ECs. Chloroquine (CQ) treated HUVECs were used as a positive control. g, Visualization of cell cycle progression using the dual fluorescence ubiquitination-based cell cycle indicator (FUCCI) reporter. Cells with red-labelled nuclei (expressing mCherry-hCdt1(30/120)) are in G0/G1 while cells with green labelled nuclei (expressing mVenus-hGeminin(1/110)) are in the S/G2/M cell cycle phase. Yellow nuclei indicate temporal co-expression of both reporters. h, Experimental timeline for the cell cycle analysis in HUVECs transduced with the FUCCI reporter. The ratio between green and red cells indicates the percentage of ECs in S/G2/M compared to G0/G1, respectively. Western blot data in f were from the respective experiment, processed in parallel, and are representative of at least three independent experiments. a and c-e, Data represent mean ± s.e.m.; a two-tailed unpaired t-test was used; *P<0.05; ** P<0.01; ***P<0.001; **** P<0.0001; NS, not significant. The numerical data, unprocessed western blots and P values are provided as source data.

