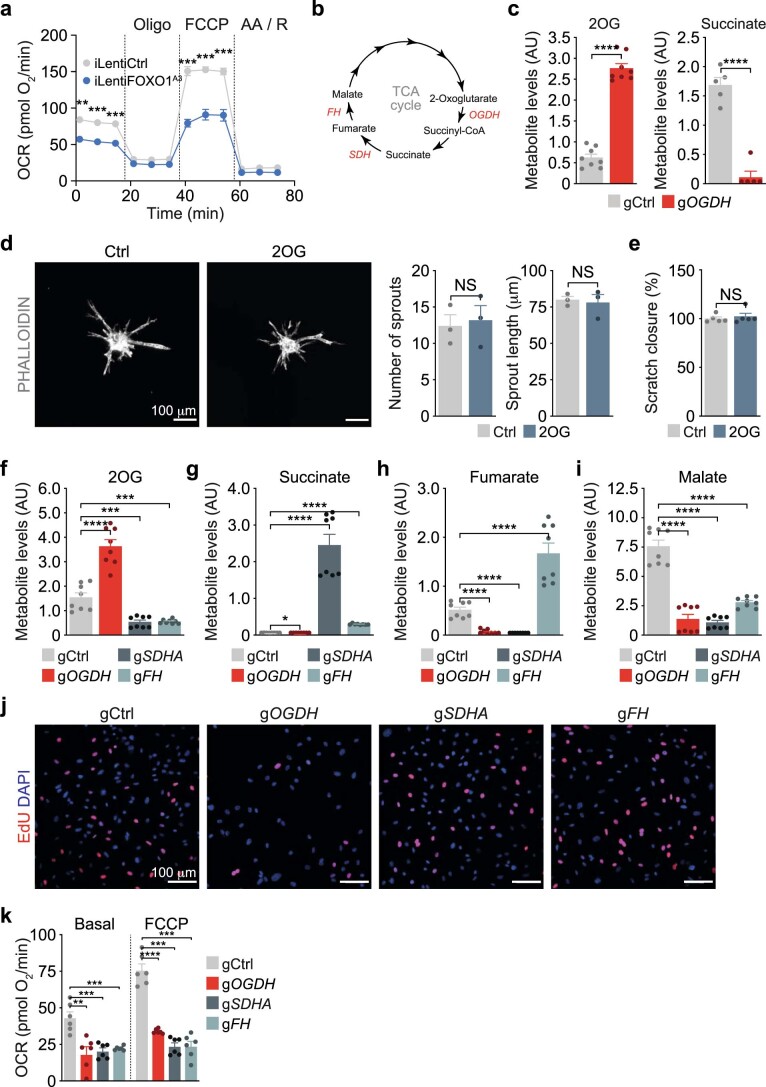
Extended Data Fig. 6. Changes in endothelial mitochondrial metabolism upon FOXO1A3 expression or OGDH depletion.
a, Oxygen consumption rate (OCR) in control (iLentiCtrl) and FOXO1A3-transduced (iLentiFOXO1A3) HUVECs 48h after doxycycline induction. Oligo, oligomycin; FCCP, fluoro-carbonyl cyanide phenylhydrazone; AA / R, Antimycin A / Rotenone, (n=4 independent samples). b, Schematic representation showing the metabolic substrates and products catalysed by the TCA cycle enzymes OGDH, SDH and FH. c, Metabolite levels of 2-oxoglutarate (2OG) and succinate in control (gCtrl) and OGDH-depleted (gOGDH) HUVECs, (2OG: n=8, 8 independent samples for gCtrl and gOGDH; Succinate: n=5, 5 for gCtrl and gOGDH). AU, arbitrary units. d, Confocal images of phalloidin- (grey) labelled HUVEC spheroids showing that 2OG does not affect endothelial sprouting. Images were taken 24h after treatment. Quantifications are shown on the right, (n=3 independent samples). e, Scratch-wound assay quantification of vehicle (Ctrl) and 2OG-treated HUVECs, (n=5 independent samples). f-i, TCA cycle metabolite levels in control (gCtrl), SDHA- (gSDHA), OGDH- (gOGDH) and FH-depleted (gFH) HUVECs, (n=8 independent samples). AU, arbitrary units. j, EdU-incorporation in gCtrl, gSDHA, gOGDH and gFH transduced HUVECs. DAPI was used to identify endothelial nuclei. k, Oxygen consumption rate (OCR) in gCtrl, gOGDH, gSDHA and gFH depleted HUVECs. Measurements were performed under basal conditions and in response to FCCP stimulation, (n=6 independent samples). a, c-i and k, Data represent mean ± s.e.m.; a two-tailed unpaired t-test was used; ** P<0.01; ***P<0.001; **** P<0.0001; NS, not significant. The numerical data and P values are provided as source data.

