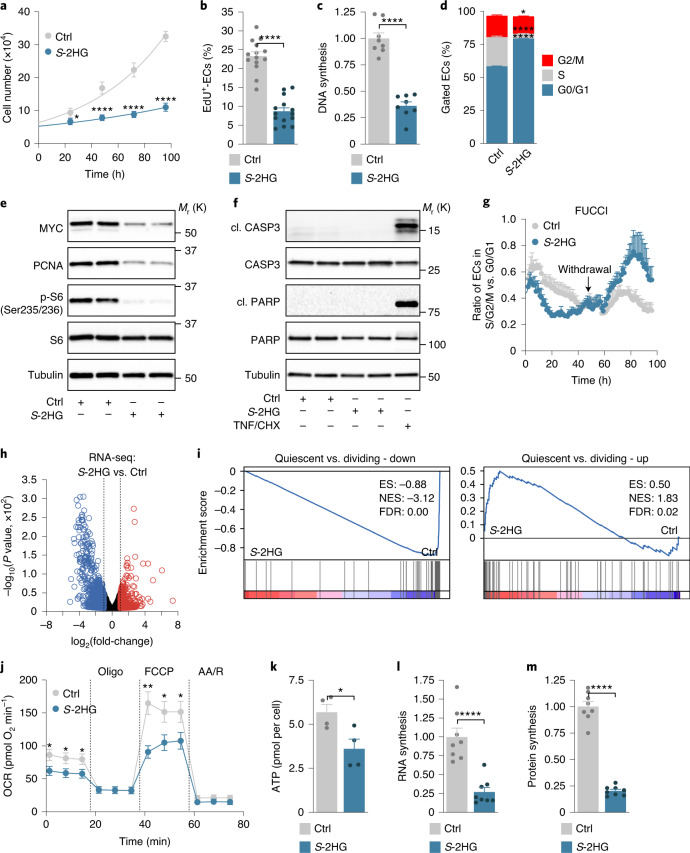
Fig. 2. S-2HG supports a quiescent endothelial phenotype.
a, Growth curves of HUVECs stimulated with DMSO (Ctrl) or cell-permeable S-2HG (n = 16 independent samples). b, EdU incorporation in control or S-2HG-treated HUVECs at 48 h. The percentage of EdU-positive ECs is shown (n = 14 independent samples). c, DNA synthesis is reduced in HUVECs treated with S-2HG for 48 h. Values represent the fold-change relative to DMSO-treated HUVECs (n = 8 independent samples). d, Cell-cycle analysis of control and S-2HG-stimulated HUVECs 48 h after treatment (n = 4 independent samples). e, Immunoblotting of proliferation and growth-associated proteins in HUVECs treated with S-2HG for 24 h. f, Immunoblot analysis of the apoptotic markers cleaved (cl.) caspase-3 (CASP3) and cleaved PARP showing that S-2HG does not cause cell death in HUVECs. TNFα (TNF) and cycloheximide (CHX) co-stimulation was used as a positive control. g, Time-course analysis of HUVECs transduced with the dual FUCCI reporter. ECs were treated with vehicle or S-2HG for 48 h, followed by withdrawal of the treatment and further analysis for 48 h (n = 3 independent samples). h, Volcano plot of differentially expressed genes in control or S-2HG-treated HUVECs at 24 h. Genes with a P value cut-off of ≤0.05 and a fold-change ≥ or ≤2 are shown (n = 3 independent samples). i, GSEA plots of quiescent versus dividing-down and quiescent versus dividing-up gene sets in the transcriptomes of control or S-2HG-treated HUVECs. ES, enrichment score; FDR, false discovery rate; NES, normalized enrichment score. j, OCRs in control or S-2HG-treated HUVECs (n = 9 independent samples). AA/R, antimycin A/rotenone; Oligo, oligomycin. k, ATP levels in HUVECs 48 h after treatment with vehicle or S-2HG (n = 4 independent samples). l, RNA synthesis is decreased, as measured by 14C-glucose incorporation into RNA, in HUVECs treated with S-2HG for 48 h. Values are represented as the fold-change relative to control (n = 8 independent samples). m, Protein synthesis is decreased, as measured by 3H-tyrosine incorporation into protein, in HUVECs treated with S-2HG for 48 h. Values are represented as the fold-change relative to control (n = 8 independent samples). Western blot data in e and f are from the respective experiment, processed in parallel, and are representative of at least three independent experiments. For a–d, g and j–m, the data represent the mean ± s.e.m.; two-tailed unpaired t-test, *P < 0.05, **P < 0.01, ****P < 0.0001. The numerical data, unprocessed western blots and P values are provided as source data.

