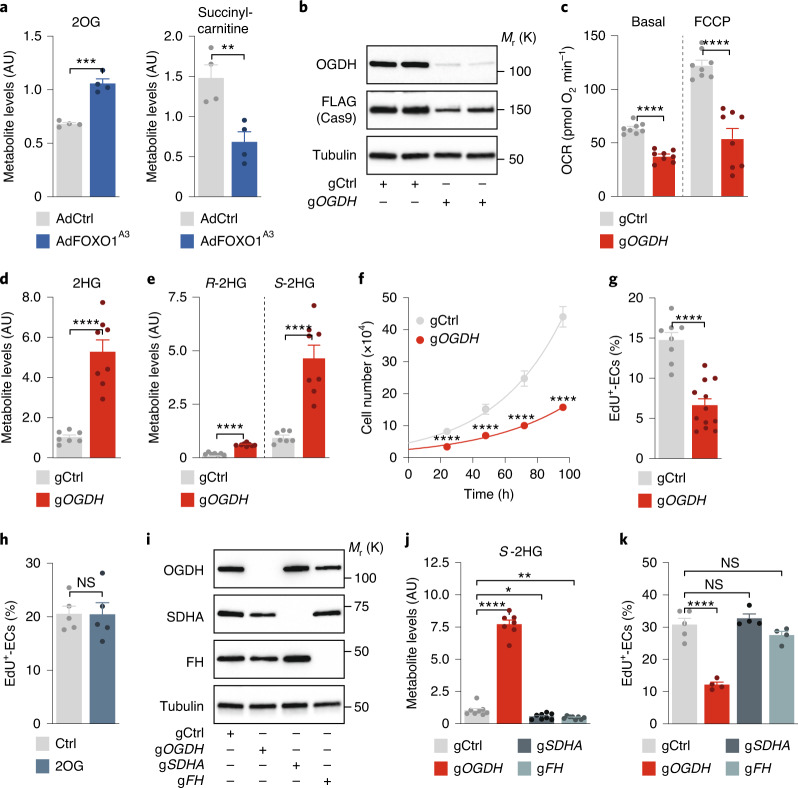
Fig. 4. OGDH inactivation induces S-2HG generation and limits endothelial proliferation.
a, Metabolite levels of 2OG and succinyl-carnitine (a surrogate for succinyl-CoA) in HUVECs transduced with control (AdCtrl) or FOXO1A3-encoding (AdFOXO1A3) adenoviruses (n = 4 independent samples). b, Immunoblot analysis of OGDH protein abundance in control and OGDH-depleted HUVECs. Cells were generated by lentiviral transduction of FLAG-tagged Cas9 nuclease and control (gCtrl) or OGDH-targeting (gOGDH) gRNAs. c, OCRs in gCtrl- and gOGDH-transduced HUVECs under basal conditions and in response to FCCP (n = 8 independent samples). d, 2HG metabolite levels in gCtrl and gOGDH HUVECs measured by LC–MS (n = 7 (gCtrl) and 8 (gOGDH) independent samples). e, Enantioselective LC–MS measurement of R- and S-2HG levels in gCtrl and gOGDH HUVECs (n = 7 (gCtrl) and 8 (gOGDH) independent samples). f, Cell-proliferation curves comparing gCtrl and gOGDH HUVECs (n = 12 independent samples). g, EdU incorporation in control and OGDH-deficient HUVECs. The percentage of EdU-positive ECs is shown (n = 8 (gCtrl) and 12 (gOGDH) independent samples). h, EdU incorporation in control and cell-permeable 2OG-treated HUVECs. The percentage of EdU-positive ECs is shown (n = 5 independent samples). i, Immunoblot analysis of OGDH, SDHA and FH protein levels in control (gCtrl) and CRISPR–Cas9-engineered HUVECs (gOGDH, gSDHA or gFH). j, LC–MS measurement of 2HG enantiomers showing that OGDH-deficient HUVECs (gOGDH), but not SDHA- or FH-deficient cells, have increased S-2HG levels (n = 8, 7, 8 and 8 independent samples for gCtrl, gOGDH, gSDHA and gFH, respectively). k, EdU incorporation in gCtrl, gOGDH, gSDHA and gFH HUVECs. The percentage of EdU-positive ECs is shown (n = 5, 4, 4 and 4 independent samples for gCtrl, gOGDH, gSDHA and gFH, respectively). Western blot data in b and i are from the respective experiment, processed in parallel, and are representative of at least three independent experiments. For a, c, d–h, j and k, the data represent the mean ± s.e.m.; two-tailed unpaired t-test, *P < 0.05, **P < 0.01, ***P < 0.001, ****P < 0.0001, NS, not significant. The numerical data, unprocessed western blots and P values are provided as source data.

