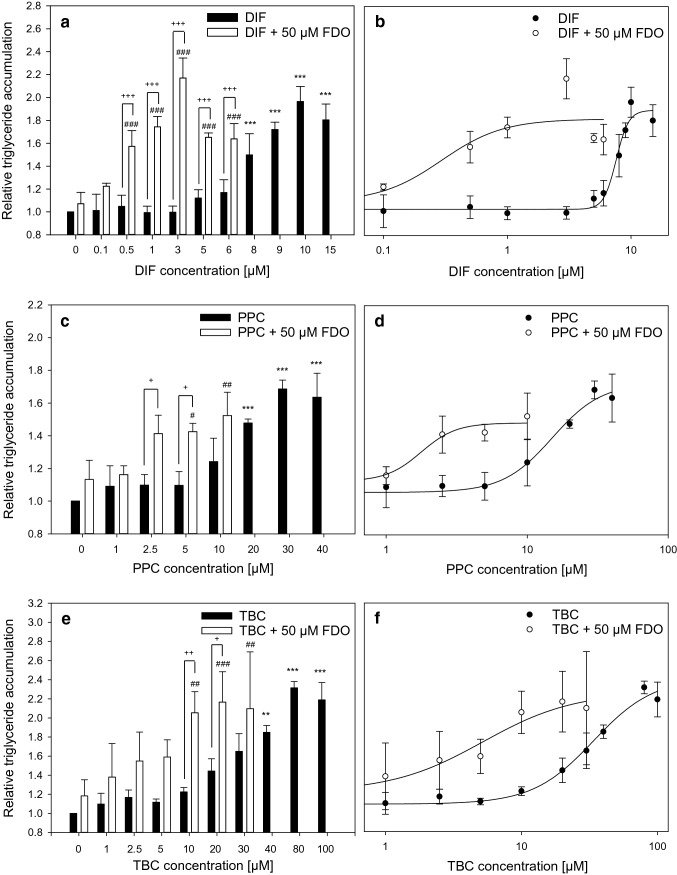
Fig. 1.
Triglyceride accumulation in HepaRG cells induced by DIF, PPC, TBC alone and their mixtures with 50 µM FDO (a, c, e). Intracellular triglycerides were measured with the AdipoRed assay after 72 h of incubation. b, d and f show the data points of DIF, PPC, TBC alone and their mixtures with 50 µM FDO, respectively, and the fitted curves for EC50 calculation. Cyproconazole (200 µM) was used as positive control (data not shown). Data represent mean ± SD (N ≥ 3 independent experiments). Statistic was done by one-way ANOVA with Holm–Sidak post hoc test (all pairwise): *p ≤ 0.05, **p ≤ 0.01 and ***p ≤ 0.001 indicate significance for single compounds (black bars) against the medium control containing 0.5% DMSO, #p ≤ 0.05, ##p ≤ 0.01 and ###p ≤ 0.001 indicate significance for combinations (white bars) against 0 µM DIF/PPC/TBC + 50 µM FDO, while + p ≤ 0.05, ++ p ≤ 0.01 and +++ p ≤ 0.001 indicate significance for single compounds (black bars) against combinations (white bars) at the same concentrations of DIF/PPC/TBC

