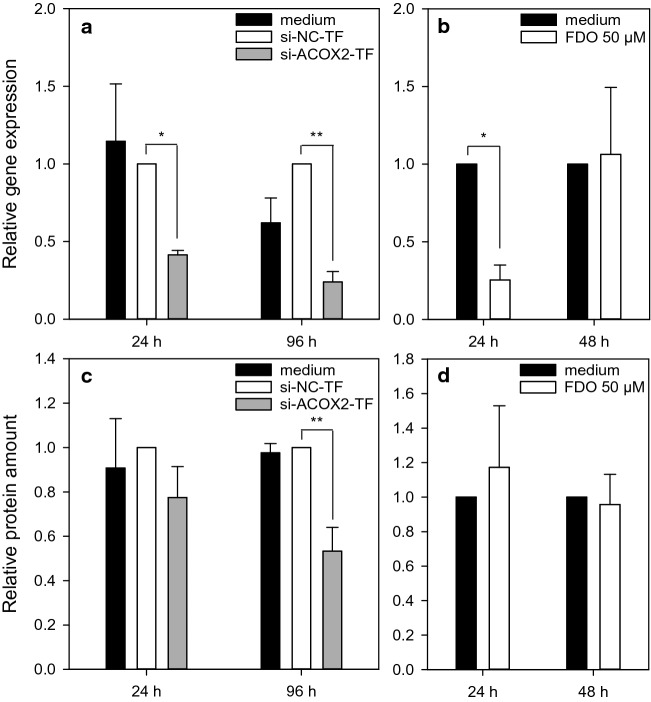
Fig. 5.
ACOX2 knockdown via siRNA. HepaRG cells were transfected twice in an interval of 24 h with siRNA for ACOX2 and with negative control siRNA. Relative gene expression (a) and protein amount (c) of ACOX2 were analyzed for transfected cells 24 h and 96 h after the second transfection. Relative gene expression (b) and protein amount (d) of ACOX2 were also analyzed for cells incubated for 24 h and 48 h with 50 µM FDO. Data represent means ± SD (N = 3 independent experiments). Statistic was done by one-way ANOVA with Holm–Sidak post hoc test (all pairwise), *p ≤ 0.05, **p ≤ 0.01 and ***p ≤ 0.001

