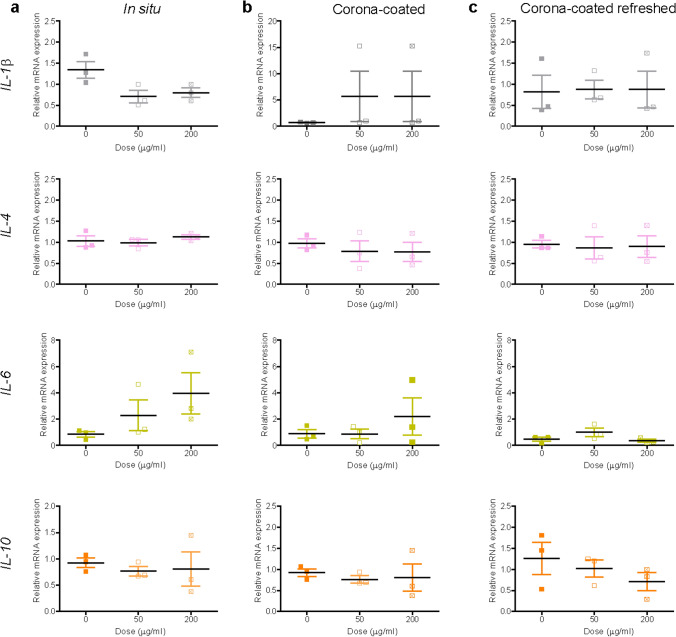
Fig. 6.
Expression of inflammation markers after SiO2 nanoparticle exposure. Liver slices were exposed for 72 h to SiO2 in WME + 5% FBS (a), and to isolated corona-coated SiO2 in serum-free medium without (b) and with (c) daily refreshment of the corona-coated SiO2 dispersion. The relative gene expression was determined by qRT-PCR and calculated using β-actin as housekeeping gene. The data are presented as the fold induction over the expression levels in slices not exposed to nanoparticle, calculated as described in the “Materials and methods” section. The results are the mean and standard error of the mean of three independent experiments. Kruskal–Wallis statistic followed by Dunnett’s multiple comparisons test were performed on ΔCt values

