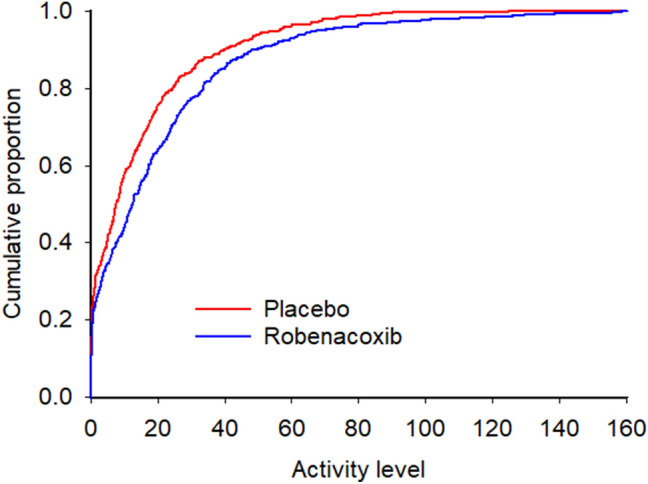
Figure 2.

Example cumulative distribution function for a single cat (LAS-31), demonstrating a rightward shift of activity during treatment with robenacoxib, as compared against treatment with placebo. This indicates that the activity counts were higher while receiving robenacoxib. P values from the Kolmogorov–Smirnov test were < 0.0001 for the hypothesis that activity with robenacoxib > placebo, and 1.0 for placebo > robenacoxib. Analysis and graphical output performed using SAS software capabilities (Version 9, SAS Institute Inc., Cary, NC).
