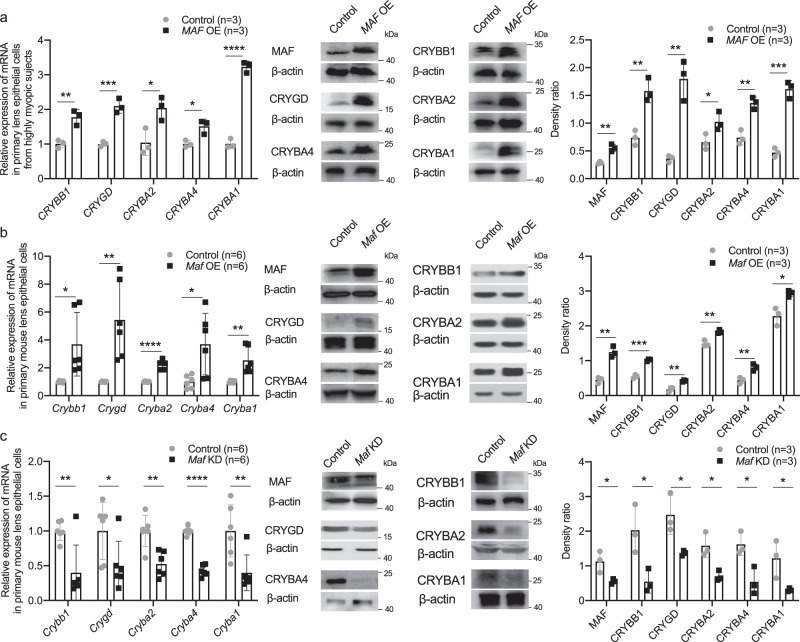
Fig. 5. MAF directly up-regulated β/γ-crystallin expression in high myopia conditions.
a Changes of β/γ-crystallin gene expression detected by qPCR (n = 3, CRYBB1 p = 0.006, CRYGD p = 9.86e-4, CRYBA2 p = 0.026, CRYBA4 p = 0.017, CRYBA1 p = 4.93e−5) and Western blotting (n = 3, MAF p = 0.002, CRYBB1 p = 0.004, CRYGD p = 0.002, CRYBA2 p = 0.044, CRYBA4 p = 0.003, CRYBA1 p = 0.0003) in primary human LECs collected from highly myopic eyes after treatment of MAF overexpression (MAF OE). Right, the band density in Western blotting was normalized to loading control as a ratio for statistical analysis. b Changes of crystallin gene expression in primary mouse LECs detected by qPCR (n = 6, Crybb1 p = 0.016, Crygd p = 0.003, Cryba2 p = 2.45e−6, Cryba4 p = 0.015, Cryba1 p = 0.003) and Western blotting (n = 3, MAF p = 0.002, CRYBB1 p = 0.0002, CRYGD p = 0.005, CRYBA2 p = 0.004, CRYBA4 p = 0.007, CRYBA1 p = 0.015) after treatment of Maf overexpression. Right, the band density was normalized to loading control as a ratio for statistical analysis. c Changes of crystallin gene expression in primary mouse LECs detected by qPCR (n = 6, Crybb1 p = 0.006, Crygd p = 0.048, Cryba2 p = 0.002, Cryba4 p = 5.87e−8, Cryba1 p = 0.009) and Western blotting (n = 3, MAF p = 0.035, CRYBB1 p = 0.029, CRYGD p = 0.028, CRYBA2 p = 0.016, CRYBA4 p = 0.022, CRYBA1 p = 0.044) after treatment of Maf knockdown (KD). Right, the band density was normalized to loading control as a ratio for statistical analysis. n=biological replicates. Results are expressed as mean ± SD. Level of significance was detected using two-sided Student’s t test (a–c). ****p < 0.0001, ***p < 0.001, **p < 0.01, and *p < 0.05. Source data are provided as a Source Data file.

