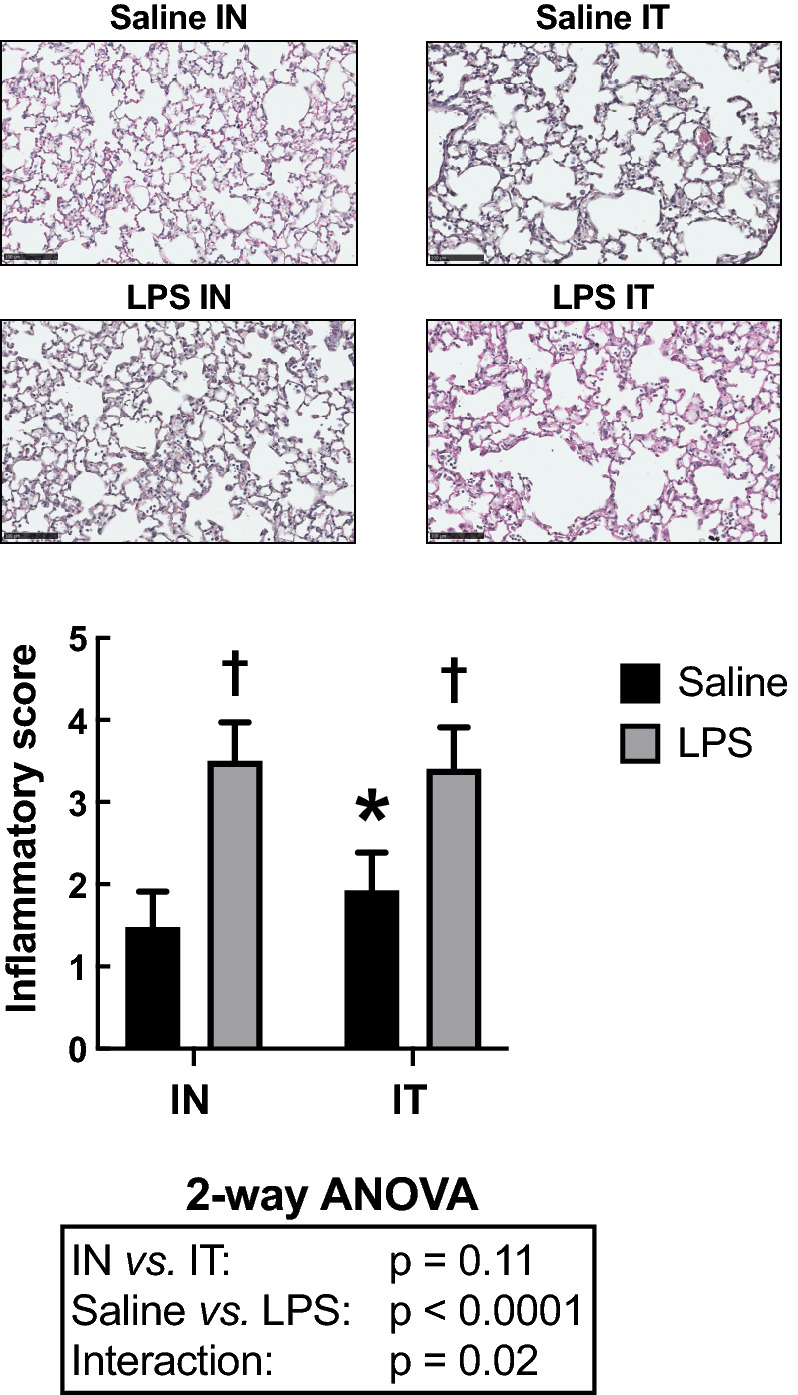
Figure 3.

Cellular inflammatory infiltrates into the parenchymal tissue. The upper panels are representative lung sections derived from mice treated with either saline (top) or LPS (bottom) through either the intranasal (IN) or the intratracheal (IT) route. The bar graph below depicts the mean inflammatory score in each group. Scale bars are 100 µm. The results of the two-way ANOVA are shown at the bottom of the graph. *Indicates statistically significant from the IN-exposed group treated with saline. †Indicates statistically significant from the group treated with saline exposed through the same route. n = 18 per group and the data shown are means ± SD.
