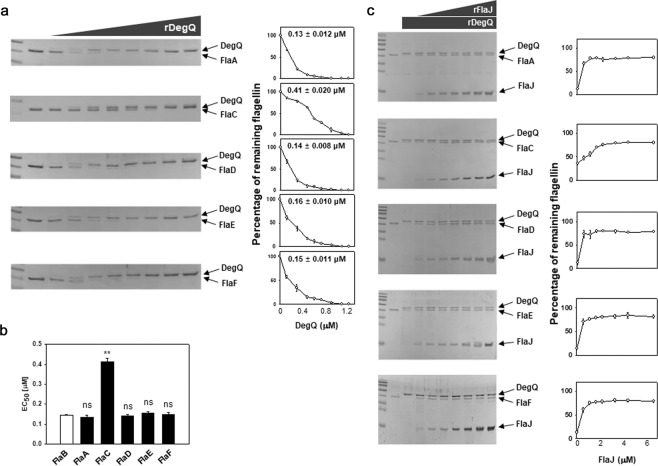
Fig. 6. In vitro proteolysis of FlaA, FlaC, FlaD, FlaE, and FlaF.
a, b Proteolysis of flagellins and flagellin-homologous proteins (FHPs) by DegQ. Recombinant proteins (1 μM each) of the flagellins (rFlaA, rFlaC, and rFlaD) and FHPs (rFlaE and rFlaF) were incubated with various concentrations of rDegQ (0, 0.12, 0.3, 0.48, 0.6, 0.72, 0.9, 1.08, and 1.2 μM). As described in Fig. 5, the remaining flagellins in reaction mixtures were resolved in SDS-PAGE (the gel images in a), and their relative amounts were plotted against the given concentrations of rDegQ with the calculated values of EC50 (the graphs in a). The average values of EC50 for proteolysis of flagellins by rDegQ were obtained from three independent assays (b). The error bars represent standard deviation. The P-values for comparison with the EC50 for rFlaB (derived from Fig. 5d) were indicated (Student’s t-test; **P < 0.005; ns, not significant). c Protection of flagellins and FHPs from DegQ proteolysis by FlaJ. The proteolysis assays were performed using the same recombinant proteins in the reaction mixtures containing 1.08 μM rDegQ and various concentrations (0, 0.56, 1.11, 1.67, 2.22, 3.34, 4.45, and 6.67 μM) of rFlaJ. Flagellins in the reaction mixtures resolved in SDS-PAGE (the gel images in c) were subjected to quantitative determination using densitometry. The relative intensities of flagellin bands were plotted against the given concentrations of rFlaJ.

