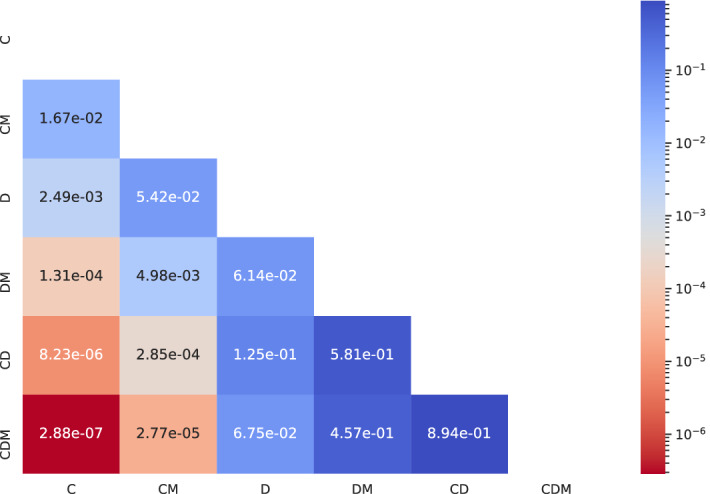
Figure 4.

Evaluating the statistical significance of each input data modality’s contribution in improving the management decision prediction . ‘C’, ‘D’, and ‘M’ refer to clinical image, dermoscopic image, and patient metadata respectively, and the row and the column names refer to the experiments in the ablation study presented in Table 4. For each pair of experiments (i) and (j), the cell (i, j) contains the p-value corresponding to the McNemar’s test performed on the corresponding pair of predictions.
