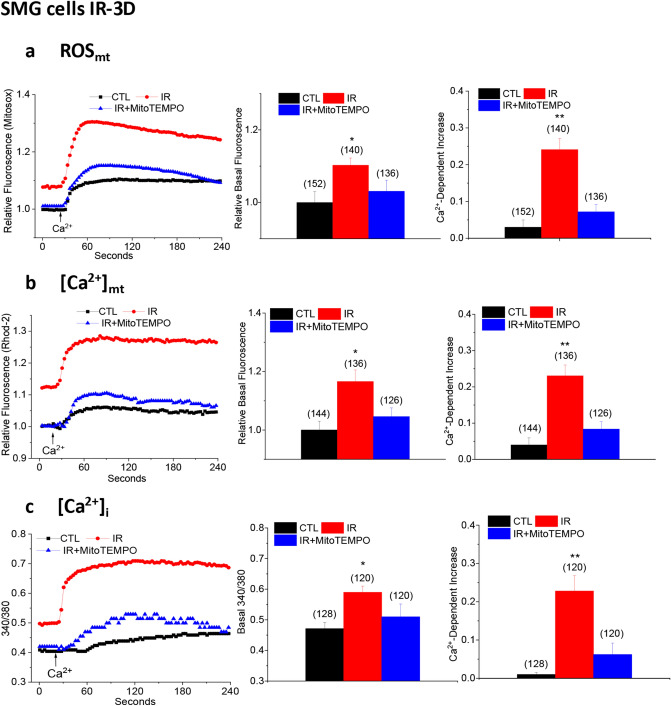
Figure 1.
MitoTEMPO suppressed IR-induced increases in ROSmt, [Ca2+]mt, and [Ca2+]i in submandibular acinar cells. (a) ROSmt was measured by monitoring the fluorescence of ROSmt indicator dye MitoSOX. Cells were first maintained in Ca2+-free medium to measure basal levels of ROSmt (basal fluorescence). Ca2+ was then added to the external medium and Ca2+-dependent increase in fluorescence was measured. Traces in the left panel shows representative MitoSOX fluorescence changes in the three groups of cells, middle panel shows quantitation of data for basal ROSmt and right panel shows Ca2+-dependent increase in ROSmt. Data were obtained from 132 to 152 cells from at least 3 different experiments. Values marked as *p < 0.05 and **p < 0.01 indicate significant difference as compared with CTL and IR + MitoTEMPO values (using unpaired t test). Unmarked values are not different from each other. (b) [Ca2+]mt was monitored by measuring the Rhod-2 fluorescence in cells under Ca2+-free conditions and after Ca2+ was added to the external medium. Similar sets of cells were used as in (a). Traces are shown in left panel, and quantitation of the data are shown in the middle and right panels; basal [Ca2+]mt and Ca2+-dependent increase in [Ca2+]mt, respectively. Data were obtained from 124–144 cells from at least 3 different experiments. Values marked as **p < 0.01 and *p < 0.05 indicate significant difference as compared to the CTL and IR + MitoTEMPO values. Unmarked values are not different from each other. Statistical comparisons were done using unpaired t test. (c) [Ca2+]i was monitored by measuring the fura-2 fluorescence in cells maintained in Ca2+-free conditions and after Ca2+ was added to the external medium. Traces are shown in the in left panel, quantitation of data in middle and right panels are shown as basal changes of [Ca2+]i and Ca2+-dependent increase in [Ca2+]i after re-addition of external Ca2+. Data were obtained from 120–128 cells from at least 3 different experiments. Values marked as **p < 0.01 and *p < 0.05 are significantly different as compared with CTL and IR + MitoTEMPO. Unmarked values are not different from each other. Unpaired t test was used to determine statistical significance of data. Values shown are mean ± SEM in each case.

