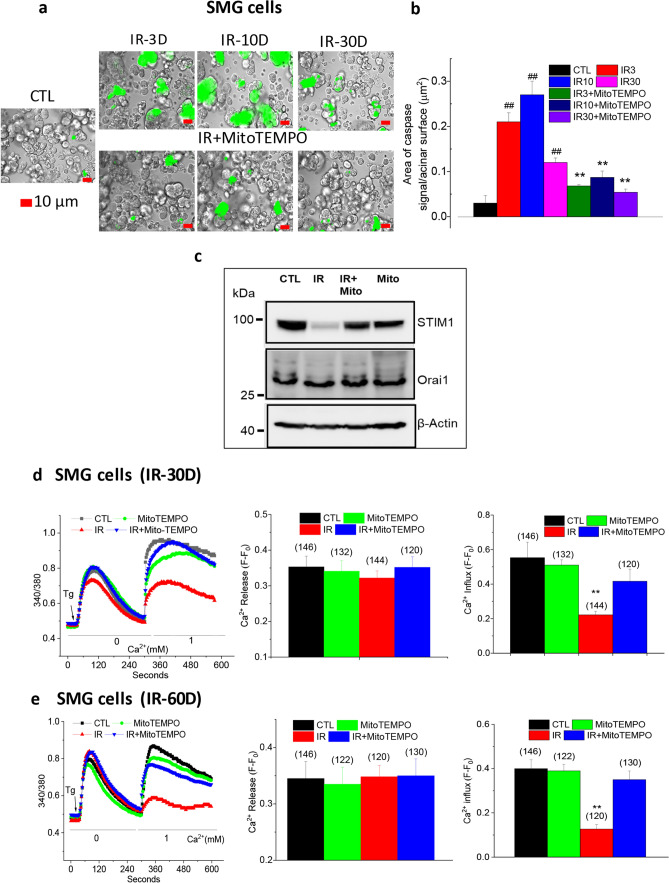
Figure 2.
MitoTEMPO treatment reduced IR-dependent activation of capsase-3 and protected STIM1 and SOCE in salivary gland cells. (a) Activated caspase-3 was detected in submandibular acinar cells using CellEvent Caspase3/7 Green Detection Reagent. The groups of cells were IR (from mice receiving 15 Gy), IR + MitoTEMPO (from mice receiving IR and MitoTEMPO); and CTL (from non-irradiated control mice). Measurements were made on days 3, 10, and 30 after IR. (scale bar = 10 µm). (b) Quantitation of caspase-3 signal/total surface acinar area for various groups of cells shown in (a). Values marked ##p < 0.01, have been compared to CTL value; **p < 0.01, indicate values that are significantly different relative to IR group at the same time points. χ2 test was used for the statistical evaluation of the data. Data were analyzed from > 200 cells from at least 3 independent experiments. (c) Western blot showing amounts of STIM1 and Orai1 proteins in salivary gland samples from CTL, IR, IR + MitoTEMPO, and MitoTEMPO groups. Blot is representative of data obtained in 3 separate experiments. STIM1 is shown in upper blot, Orai1 in middle blot and actin as loading control in the lower blot (IB antibodies are indicated in the figure). STIM1 and Orai1 images are from the same blot. After the proteins were transferred onto the membrane, it was cut into two (between the 70 kDa and 50 kDa markers). The upper part of the membrane was probed for STIM1 whereas the lower part was probed for Orai1. For β-actin, the samples derived from the same experiment were used and all the steps (electrophoresis, transfer, blotting and imaging) were performed in parallel. Images of the uncropped blots for each protein are shown in supplemental section (Fig. S3). (d,e) Fura-2 fluorescence was monitored in acinar cells of mice 30 (d) and 60 (e) days after IR (CTL, MitoTEMPO, IR, and IR + MitoTEMPO as described above). SOCE was induced by Tg treatment. The left panels in c and d shows traces of fluorescence changes in the cells (representative of data from at least 3 individual experiments). The first increase in fluorescence in Ca2+-free medium represents Ca2+ release from ER and the second peak of fura-2 fluorescence indicates Ca2+ entry. Quantitation of Tg-induced Ca2+ release and Ca2+ influx are shown in middle and right panels, respectively. Data were obtained from 120 to 146 cells in at least 3 independent experiments in each case. **p < 0.01, indicates values that are significantly different as compared to unmarked values (calculate using unpaired t test). Values shown are mean ± SEM in each case.

