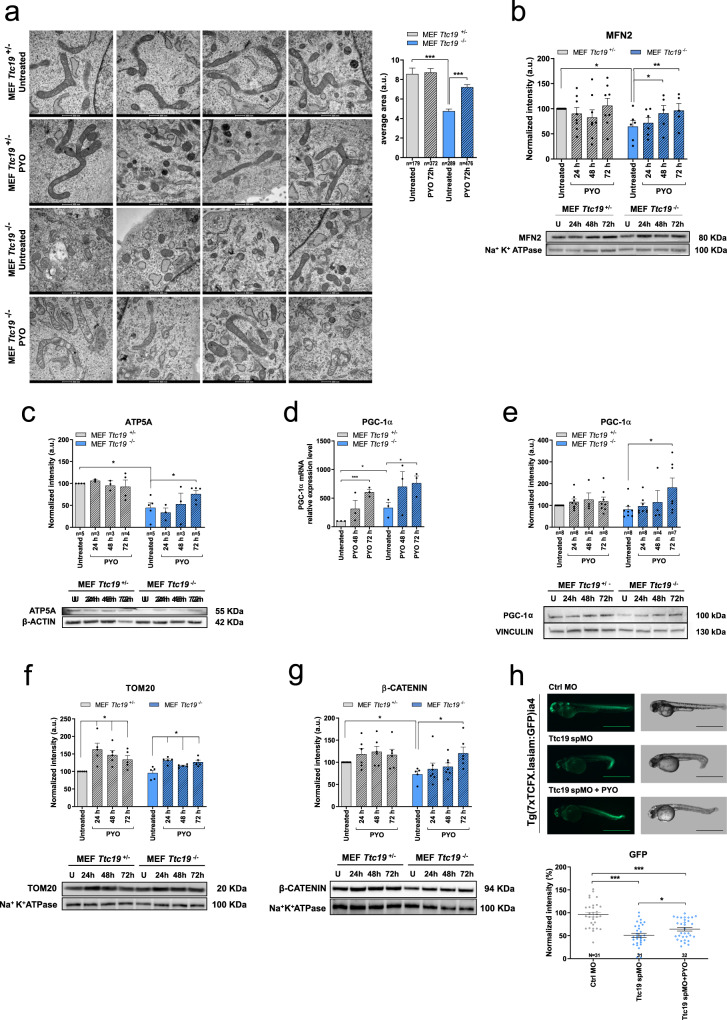
Fig. 3. PYO improves mitochondrial morphology in Ttc19 KO mouse embryonic fibroblasts.
a Representative transmission electron microscopy images of MEF Ttc19+/− and MEF Ttc19−/− left untreated or treated for 72 h with 1.5 μM PYO. The average mitochondrial cross-sectional area was calculated for each condition using the ImageJ software. Quantification is shown (means ± SEM, n of the counted mitochondria is reported in the image). Scale bars: 500 nm. b, c Protein levels of Mitofusin-2 (b, n = 6 independent experiments), ATP5A (c, the value of n is reported in the figure), were assessed by Western blot. MEF Ttc19+/− and MEF Ttc19−/− were left untreated or treated for 24, 48, or 72 h with 1.5 μM PYO. Quantification by densitometry (means ± SEM) from independent experiments is reported in the upper part of the panels, while representative blots are presented in the lower parts. Na+K+ ATPase or β-actin were used as loading controls. d. Real-time PCR analysis of the transcription of Pgc-1α was assessed in MEF 9Ttc19+/− and MEF Ttc19−/− either left untreated or treated with 1.5 μM PYO for 48 or 72 h. All values were normalized on β-actin expression. The values are reported as means of percentages of RNA expression ± SEM (n = 3 independent replicas) with reference to the untreated Ttc19+/− sample, as indicated in the figure. e, f as in (b, c) using antibodies against PGC-1α (e, value of n is reported in the image) and TOM20 (f, n = 5 technical replicates over three biologically independent samples). Vinculin or Na+K+ ATPase were used as loading controls. Data are shown as means ± SEM. g One hundred nanomoles of PYO enhances Wnt signaling in MEF Ttc19+/− and MEF Ttc19−/− cells incubated with PYO for the indicated times (means ± SEM, n = 7 technical replicates over three biological independent samples). h PYO significantly increases Wnt signaling in a zebrafish reporter line following incubation of the embryos with nonlethal 100 nM concentration for 24 h (n = 31 embryos for each condition). Scale bars: 1 mm. Statistical significance (one-way ANOVA with Dunnett’s multiple comparison test or two-tailed Student’s t test) was calculated for all panels (*p < 0.05; **p < 0.01; ***p < 0.001).

