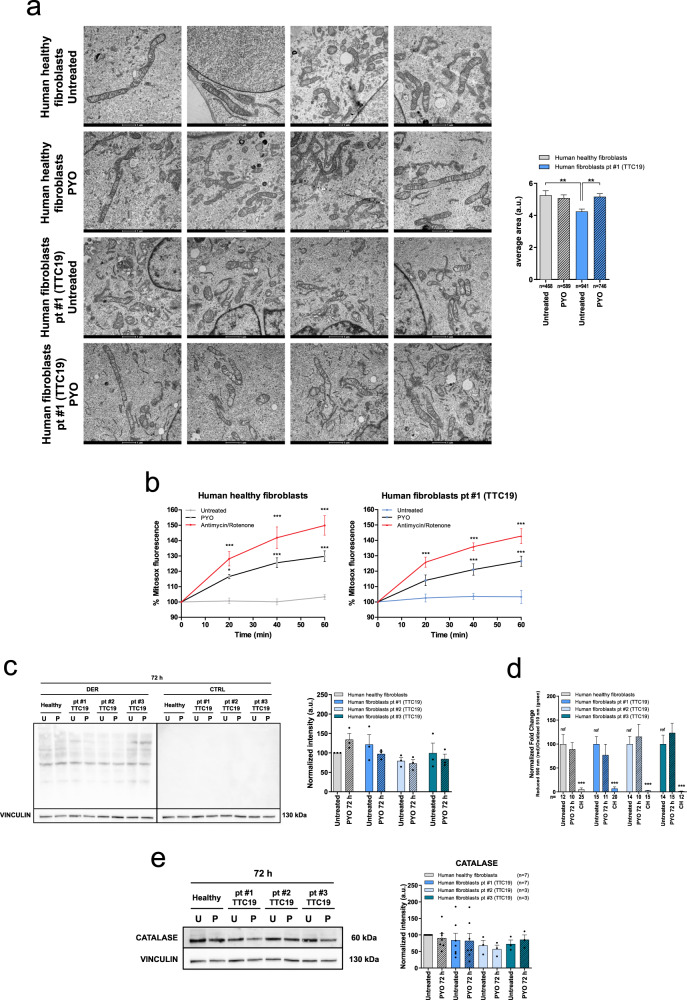
Fig. 5. PYO recovers mitochondrial morphology in human fibroblasts from patients with TTC19 gene mutations, with no oxidation toxicity.
a Representative transmission electron microscopy images of human healthy fibroblasts and fibroblasts from patient #1, untreated or treated for 72 h with 0.8 μM PYO. Sample preparation and images analysis were performed as in Fig. 3a. Quantification is shown (means ± SEM) and the number of mitochondria counted is reported in the histogram. Scale bar: 1 µm. b Mitochondrial ROS production by human healthy and by fibroblasts from patient #1 was determined by measuring the intensity of Mitosox fluorescence as in Fig. 2a. PYO was added at a final concentration of 0.8 μM. Values are means ± SEM (n = 4 independent experiments). c Representative oxyblot and the relative quantification of the protein oxidation level of healthy fibroblasts and patients’ samples, both untreated and treated with 0.8 μM PYO for 72 h (means ± SEM, n = 3 independent experiments). d Quantification of the lipid peroxidation in human healthy fibroblasts and fibroblasts from patients #1, #2, #3, untreated or treated for 72 h with 0.8 μM PYO. Cumene hydroperoxide (CH) was used as a positive control. Representative images are presented in Figure S3f (means ± SEM). The number of images quantified, recorded in three independent experiments, is reported. e Representative Western blot and the relative quantification of the catalase expression level in human healthy fibroblasts and fibroblasts from patients carrying TTC19 mutations, both untreated and treated with 0.8 μM PYO for 72 h (means ± SEM of independent experiments). Statistical significance (two-way ANOVA with Bonferroni post test or two-tailed Student’s t test) was determined for all panels (*p < 0.05; **p < 0.01; ***p < 0.001).

