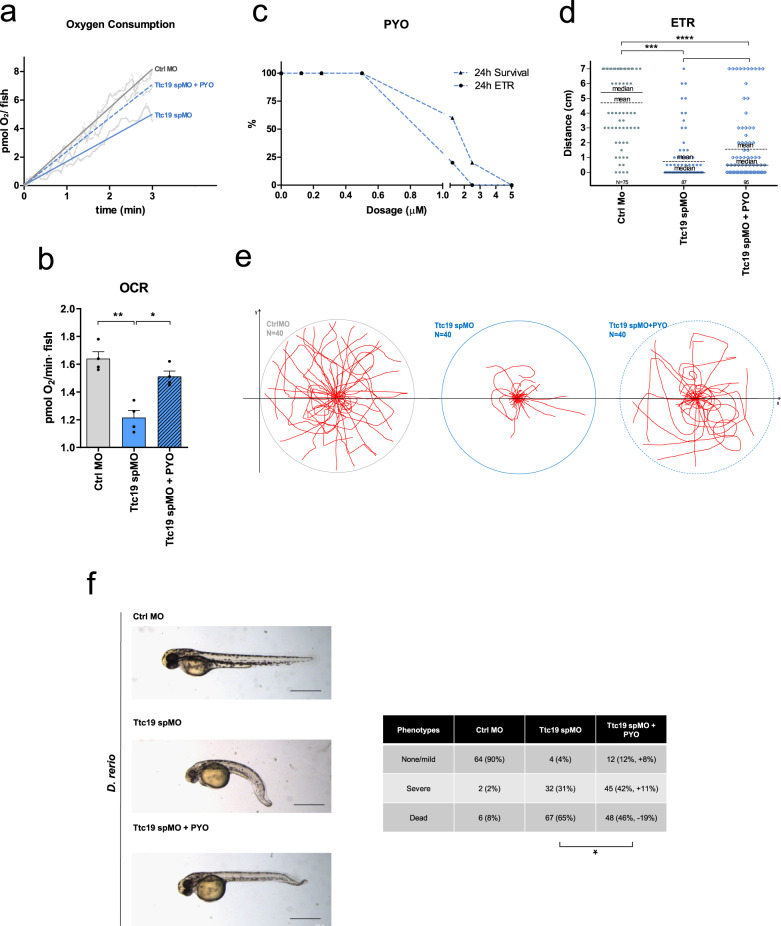
Fig. 7. Characterization of TTC19 KD zebrafish treated with PYO.
a, b OCR was analyzed in control morpholino (Ctrl MO), TTC19 KD (Ttc19 spMO), and 100 nM PYO-rescued Ttc19 spMO zebrafish. Respiratory capability of zebrafish (72 h post fertilization (hpf)) was analyzed by oxygraph technology. O2 consumption/fish is shown in graphs, including the best linear fit (quantified in b), reporting 180 s of a mean plot obtained from six independent experiments. Shown are data for Ctrl MO, Ttc19 spMO, and 100 nM PYO pre-treated Ttc19 spMO (n = 6 biological replicates with 15 randomly selected individuals for each replicate). SEM is reported as a dashed line for each group of fishes (a). Δ[pmolO2]/fish × min of treated fish are reported for Ctrl MO, TTC19 KD, and rescue, respectively (b). Statistical analysis was performed by the two-tailed Student’s t test. (*p < 0.05, **p < 0.01). Bars refer to SEM. c PYO dose–response survival assay was performed in embryos exposed to the indicated doses of the drug for 24 h. Vitality and positive reaction to evoked touch response (ETR) were assessed. d ETR assays were performed in 72 hpf zebrafish, to assess embryo movements by measuring the distance (cm) between the initial (center of the Petri dish) and the final position of the embryo measured as linear distance traveled starting from the center. Statistical analysis was performed by the two-tailed Student’s t test. (*p < 0.05, ***p < 0.001), means and medians are reported in the graph. The number of manipulated embryos is also reported. e Traces of movement of 40 individual fishes/Petri dish (circle) placed in the center of the dish and stimulated by touch. Fishes treated with 100 nM PYO (rightmost figure) were able to partially recover movement (see also Movie 1). f TTC19 KD induces body shortening and tail malformation in comparison to sibling controls. One hundred nanomoles of PYO was administered in the fish water at 12 hpf, partially rescuing body malformation and in part death (n = 6 biological replicates, the precise number of analyzed zebrafish for each phenotype is reported in the figure). Scale bars: 0.5 mm. Statistical analysis was performed by the two-tailed Student’s t test (*p < 0.05).

