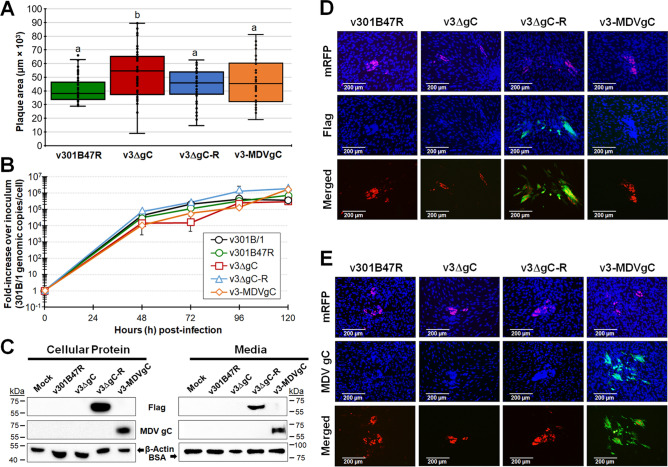
Figure 3.
Replication and expression of proteins in cell culture. (A) Mean plaque areas for viruses reconstituted from r301B47R, r3ΔgC, r3ΔgC-R, and r3-MDVgC were measured and shown as box & whisker plots. Significant differences were determined using one-way ANOVA (p < 0.05, n = 200). Mean plaque areas with different letters are significantly different using LSD and Tukey’s post hoc tests (p ≤ 0.05). (B) Multi-step growth kinetics was used to measure virus replication in CEC cultures. The mean fold-change in viral DNA copies over the inoculum is shown for each virus and time point. There were no differences in virus growth (p > 0.05, two-way ANOVA, LSD, n = 3) (C) Western blotting to confirm 301B/1 gC and MDV gC expression. Both total cellular protein and infected cell culture media were used to detect 3 × Flag tagged 301B/1 gC and MDV gC. Anti-Flag M2 was used to detect 301B/1 gC, while anti-MDV gC A6 antibody was used to confirm MDV gC expression. For protein loading control, mouse anti-β-actin was used for total protein, while anti-BSA was used for infected cell media. (D and E) Expression of 301B/1 gC in v3ΔgC-R and MDV gC in v3-MDVgC. Representative plaques for all four viruses were stained with anti-Flag (D) or -MDV gC A6 (E) antibodies with goat anti-mouse-Alexa488 (green) as secondary antibody. Fluorescent expression of mRFP (red) was directly visualized and cells were counterstained with Hoechst 33342 to visualize nuclei. Only anti-Flag (D) or -MDV gC (E) and pUL47mRFP are shown in the merged images.

