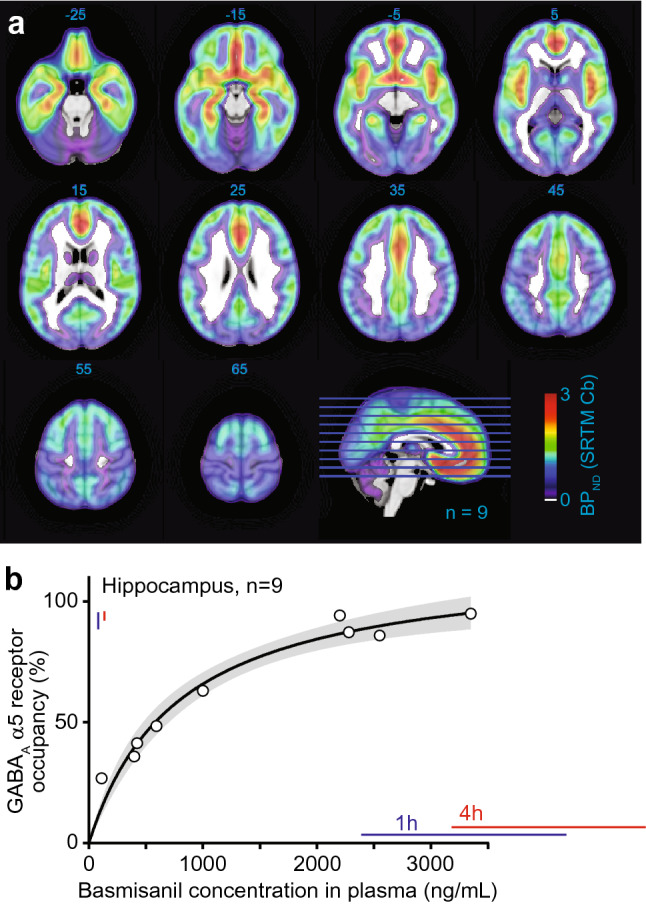
Figure 5.

Dose-dependent GABAA-α5 receptor occupancy by basmisanil in human brain. (a) Representative [11C]-Ro 15-4513 PET images in healthy human subjects showing the GABAA-α5 receptor distribution. BPND binding potential, SRTM simplified reference tissue model, Cb cerebellum. Numbers for each slice indicate the axial slice location in MNI coordinates. Blue and red bars indicate plasma exposure and receptor occupancy ranges (mean ± standard deviation) at time-points where EEG was recorded (1 h and 4 h post morning dose after 14 days of 240 mg basmisanil dosing twice daily). (b) Relation between basmisanil concentration in plasma and receptor occupancy derived from nine subjects. Emax model fit (E = Emax × C/(EC50 + C)), gray band indicates 95% confidence interval determined by the profile likelihood method. Blue and red bars indicate mean ± SD of blood plasma concentrations in the EEG experiment at 1 h and 4 h post morning dose at day 14, respectively.
