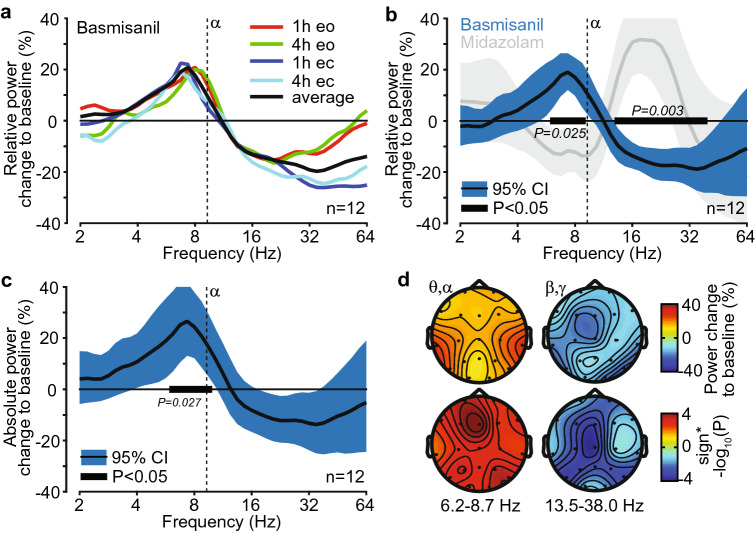
Figure 6.
Electrophysiological signature of basmisanil in healthy volunteers. (a) Relative power change of EEG signals averaged across electrodes in response to basmisanil, separately for eyes open and eyes closed conditions at 1 and 4 h post morning dose after 14 days of 240 mg basmisanil treatment twice daily. (b) Relative power change of EEG signals averaged across electrodes in response to basmisanil (average of eyes open and eyes closed conditions, 1 h and 4 h post morning dose after 14 days of 240 mg basmisanil treatment twice daily) and in response to midazolam (grey: eyes open and eyes closed, 1 h post single dose of 2 mg). Black bars indicate significant effects for basmisanil (cluster randomization test). (c) Absolute power change of EEG signals averaged across all electrodes in response to basmisanil (average of eyes open and eyes closed conditions, 1 and 4 h post morning dose after 14 days of 240 mg basmisanil treatment twice daily). Black bar indicates significant effect (cluster randomization test). (d) Spatial distribution of power changes and p-values (derived from t-tests) for the two significant clusters identified for basmisanil (black bars in (b)). Top panel: power changes; bottom panel: p-values; left: low-frequency cluster (6.2–8.7 Hz); right: high-frequency cluster (13.5–38.0 Hz). CI confidence interval (uncorrected for multiple testing across frequencies). See Supplementary Fig. S5 for additional EEG analyses and Fig. 5 for basmisanil exposure and receptor occupancy ranges during EEG assessments.

