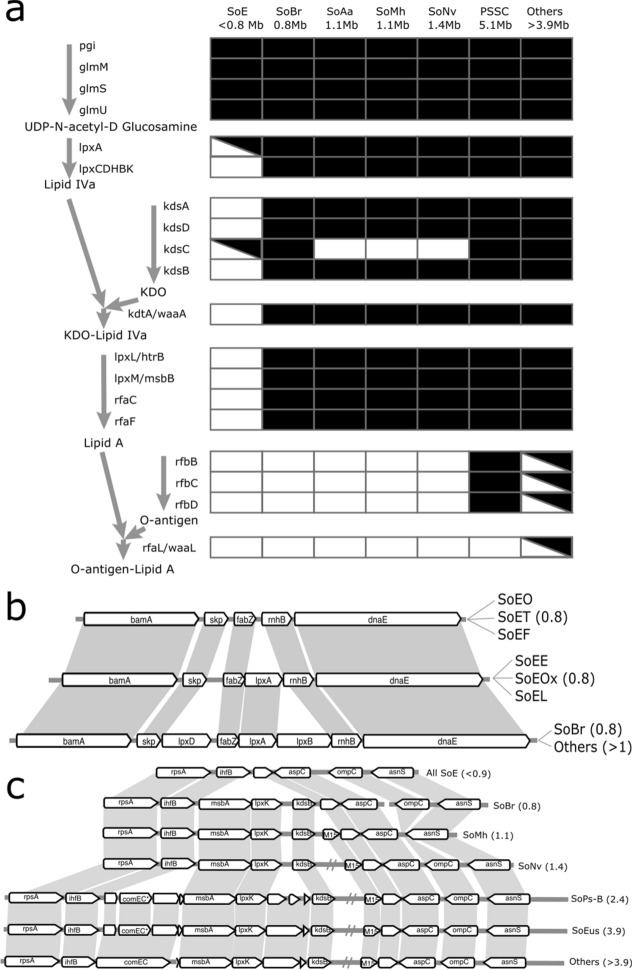
Figure 4.
Genes involved in the production of Lipid A and attachment of O-antigen. (a) Intermediate metabolites are represented in bold and the presence or absence of a gene is represented in the table, with a crossed box indicating not present in all members. (b) Progressive elimination of lpxA, lpxB, and lpxD in the SoE. (c) Loss of lpxK kdsB, and adjacent genes. A double grey line indicates a region of approximately 15 kb containing several genes not shown here. Genes labeled ‘hypoth.’ or unlabeled indicate hypothetical proteins or interrupted CDS. Asterisk indicates a fragmented CDS. Numbers in parentheses correspond to genome sizes in Mb.

