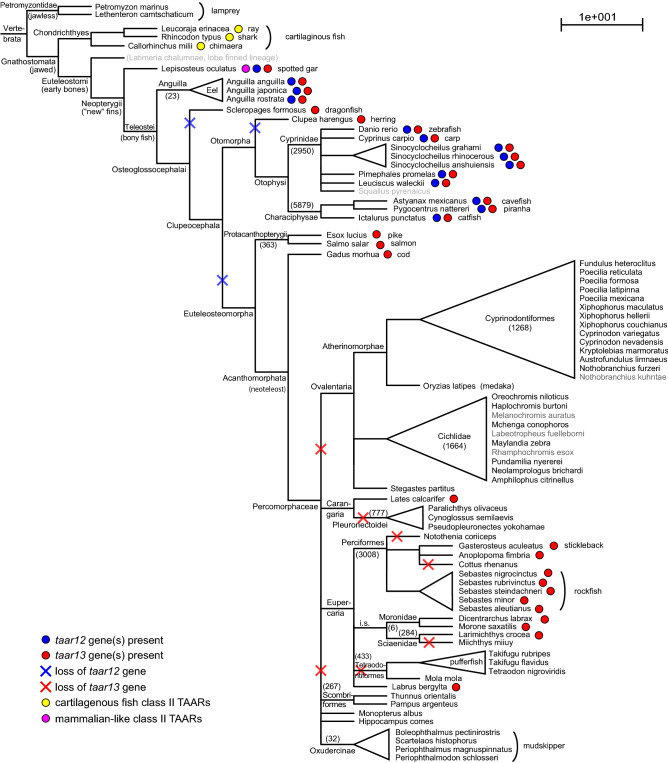
Figure 8.
Gene gains and losses visualized in species tree. Phylogenetic species tree including all species whose genomes were analysed. Latin names are shown, for vernacular names see Table 1. Reference species and species with incomplete genome are shown in grey. The tree was drawn based on the phylogenetic relationships shown in25. Some higher order classifications are included for clarity, with the number of species in the respective clade given in parentheses44. Yellow dots, class II TAARs are present in the respective species; magenta dots, mammalian-like class II TAARs are present; red dots, taar13 genes are present; blue dots, taar12 genes are present. Crosses depict gene losses predicted according to maximum parsimony.

