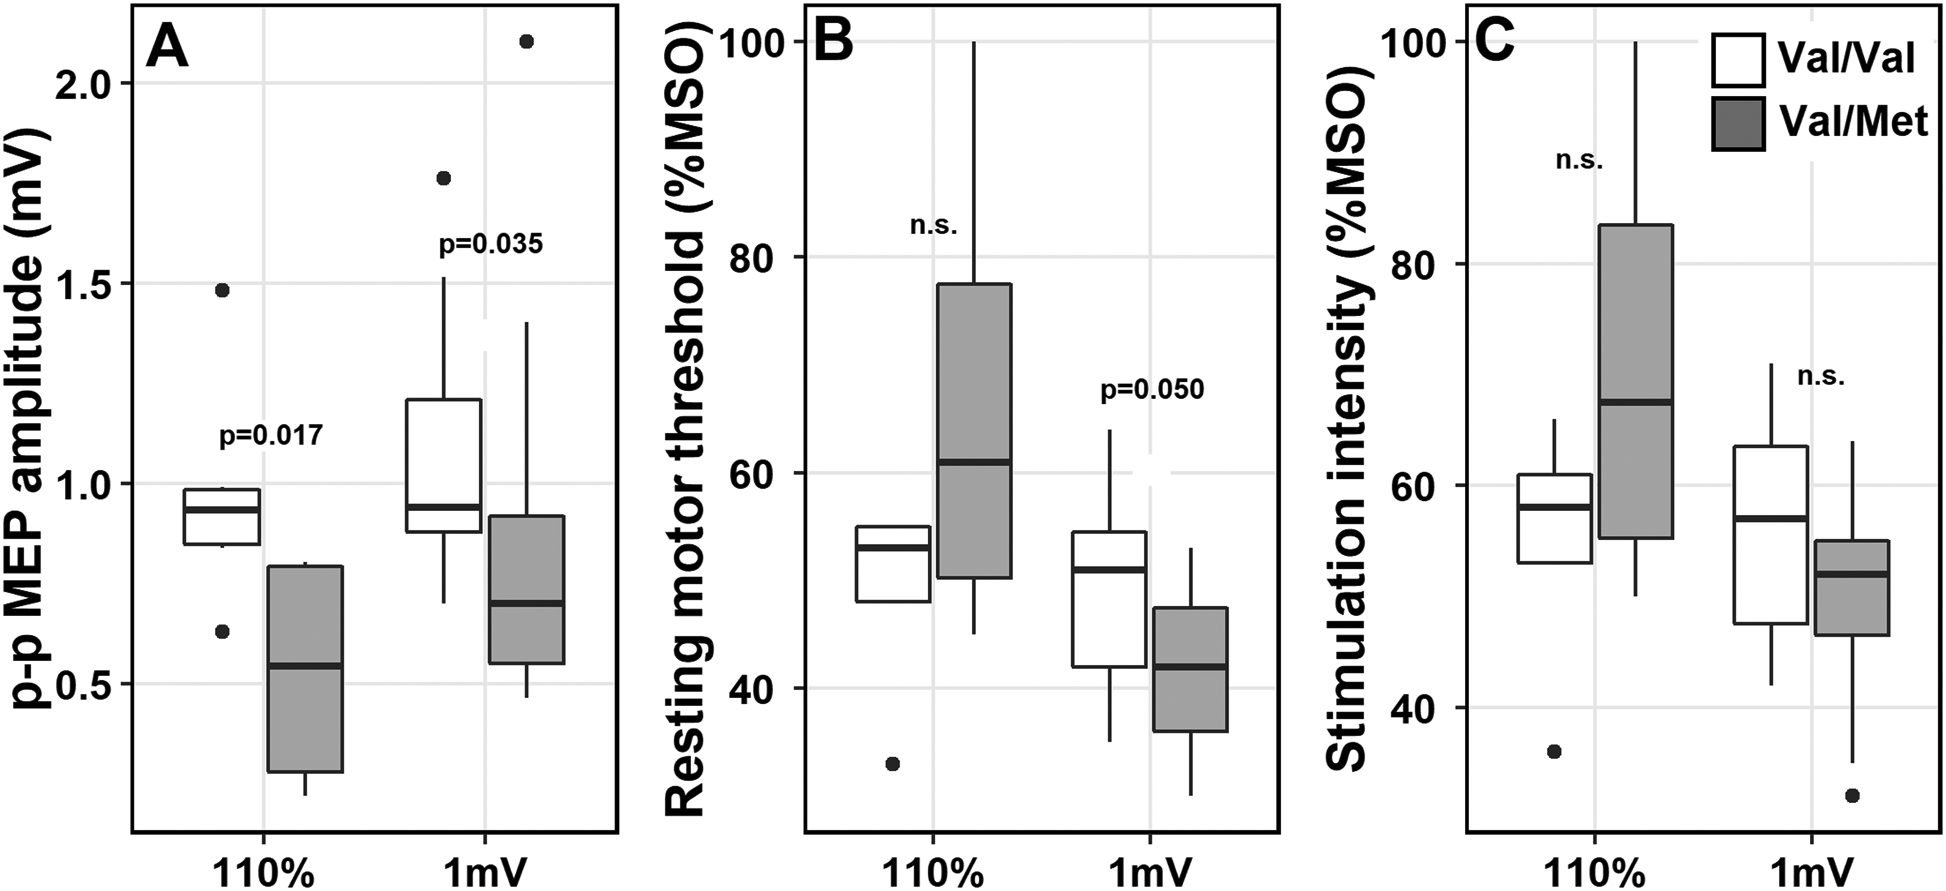
Figure 1.

Boxplots displaying differences in TMS parameters in two stimulation intensity protocol groups (110% and 1 mV). A, Peak-to-peak (p-p) MEP amplitudes were lower in the Val/Met individuals compared to Val/Val; B, resting motor thresholds were lower for Val/Met compared to Val/Val in the 1mV group but not in the 110% group; C, No differences were found in stimulation intensities. mV = millivolts; %MSO = maximum stimulator output; n.s. = not significant. P-values reported from the ANCOVA model outputs for MEP amplitudes and from Wilcoxon rank sum test for resting motor thresholds and stimulation intensities.
