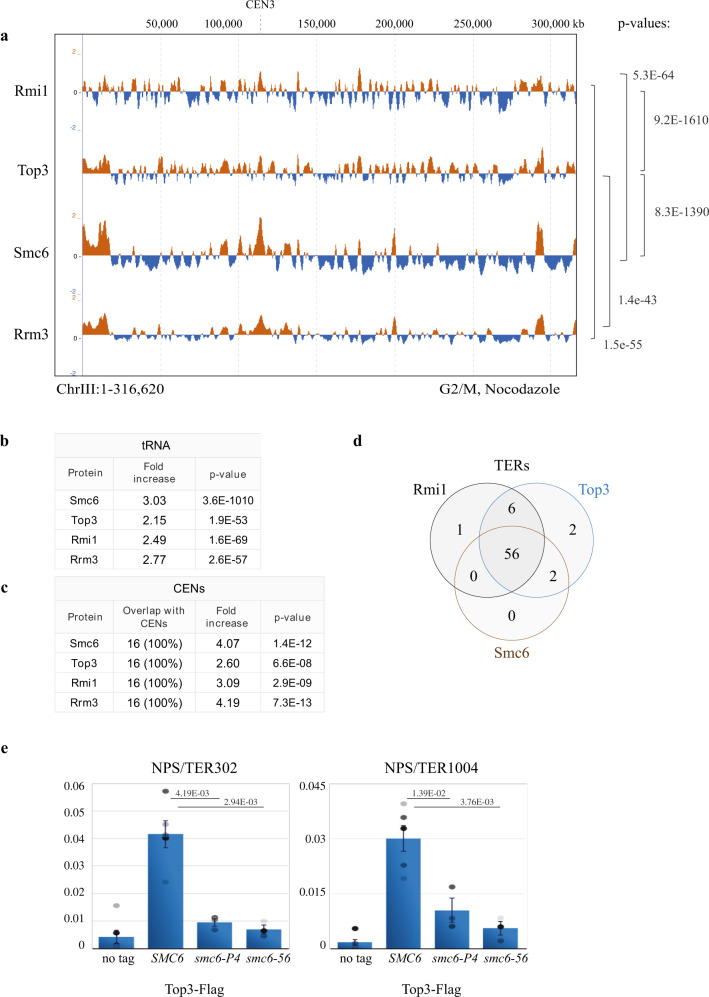
Fig. 1. STR clusters are enriched at NPSs and co-localize with Smc5/6.
a ChIP-on-chip profile of Rmi1-Flag, Top3-Flag, Smc6-Flag and Rrm3-Flag from G2/M-synchronized cells. Chr III is shown as example. The indicated p-values (one-tailed Fisher’s exact test) relate to the genome-wide overlap between the considered protein clusters. Evaluation of the significance of overlap between the binding clusters of different proteins was performed by confrontation against a null hypothesis model generated with a Montecarlo-like simulation where the “score” for both the randomized positions and the actual data was calculated as the total number of overlapping bases among the whole clusters. The significance of correlation was scored using a one-tailed Fisher’s exact test described in detail in the Supplemental Statistical Analysis document in ref. 68. b Analysis of overlap between specific types of elements found at NPSs and clusters of the indicated proteins shows that similar to Smc5/6 and Rrm3, Top3 and Rmi1 are enriched at tRNAs genes. The table reports the fold increase of each protein at tRNA genes, calculated versus the ones expected for random binding, and the p-values (one-tailed Fisher’s exact test) of significance (see legend of panel a). c As in b, but for centromeres (CENs). d Smc5/6, Top3 and Rmi1 are enriched at NPSs that serve as termination sites (TERs) in G2/M. Values of overlap and non-overlap between the protein clusters are shown. e ChIP-qPCR profile of Top3-Flag from G2/M-synchronized WT and smc6-56, smc6-P4 cells at different TER regions. The plotted mean value is derived from three biological replicates for smc6-56 and smc6-P4 and six biological replicates for no tag and Top3-Flag. Data are presented as mean value ± SEM. The indicated p-values were calculated by unpaired two-sided t-test. See also Supplementary Figs. 1 and 2. Source data are provided as a Source Data file.

