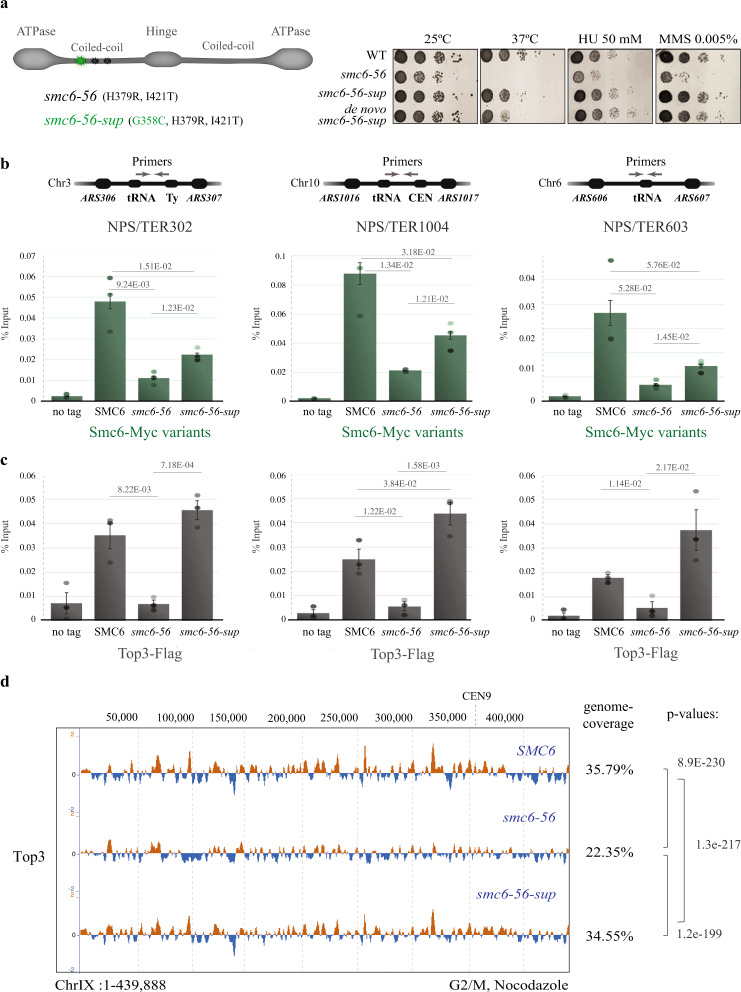
Fig. 4. Intra-allelic smc6 suppressor unveils tight links between Smc5/6 and Top3.
a Schematic representation of the smc6-56 suppressor screen. Representation of the point mutations in smc6-56-sup and validation of the suppressor by creating the suppressor mutation de novo in smc6-56. b ChIP-qPCR analysis of Myc-tagged Smc6 and variants versus no tag in G2/M phase at three indicated NPSs. c ChIP-qPCR analysis of Top3-Flag in WT, smc6-56 and smc6-56-sup versus no tag in G2/M phase at three indicated NPSs. For ChIP-qPCR (b and c), the % Input is derived from three biological replicates and data are presented as mean value ± SEM. p-values were calculated by an unpaired two-tail t-test. d ChIP-on-chip profile of Top3-Flag from G2/M-synchronized WT, smc6-56 and smc6-56-sup mutant cells performed in two biological replicates. Chr IX is shown as example. The indicated p-values (one-tailed Fisher’s exact test) relate to the genome-wide overlap between the considered protein clusters (see legend of Fig. 1a for details). Genome coverage percentage of Top3 is indicated. See also Supplementary Fig. 5. Source data are provided as a Source Data file.

