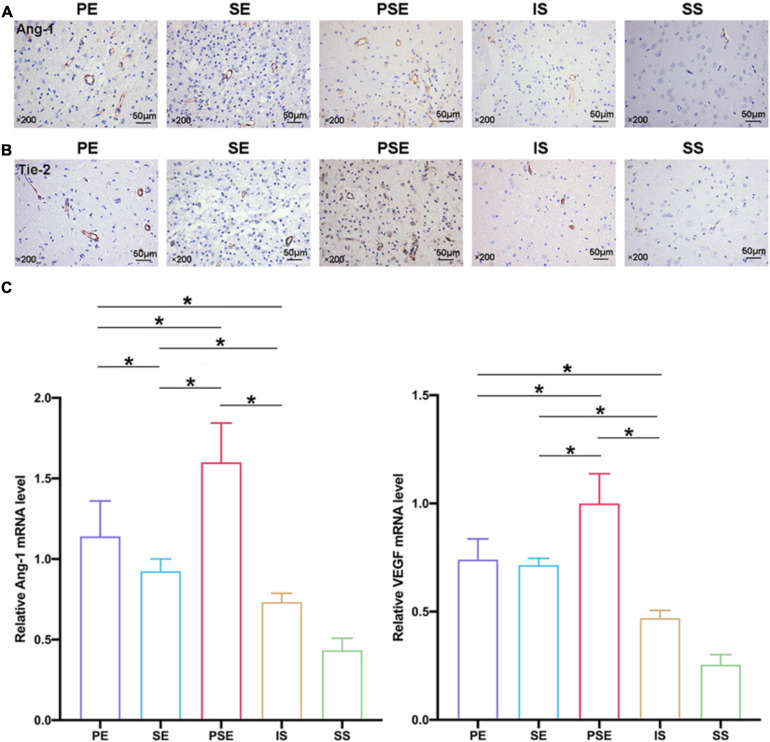
FIGURE 5.
Angiogenic factors expression in the penumbra at 14 days after ischemia/reperfusion. (A) Representative magnification images of Ang-1 immunohistochemical staining of five groups. (B) Representative images of Tie-2 immunohistochemical staining of five groups. (C) Quantitative analysis of relative VEGF/Ang-1 mRNA levels in five groups, while PE, SE, and PSE conditionings increased Ang-1 and VEGF mRNA levels compared to IS group. n = 6. Data are expressed as mean ± SEM; *P < 0.05.

