Figure 3.
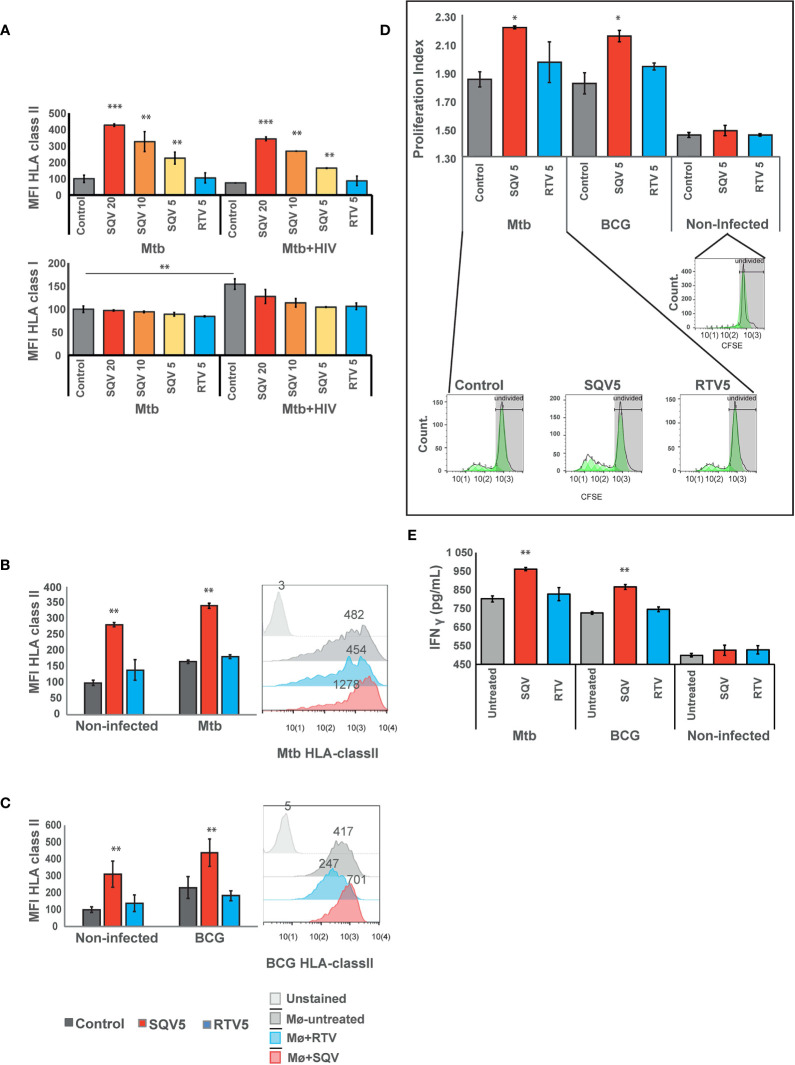
SQV results in increased expression of HLA class II antigen presentation machinery (A) Surface expression of human leukocyte antigen (HLA)-class II or class I on Mø infected with Mtb or co-infected with HIV. (B) Surface expression of human leukocyte antigen (HLA)-class II on Mø infected with Mtb or (C) BCG compared to non-infected Mø. HLAs were measured by flow cytometry after 24 h of infection. Values in bar plots represent the average of median fluorescence intensity measured on three biological replicates from one representative experiment performed in triplicate relative to control. Error bars depict standard deviation (**P < 0.001, relatively to control). Raw values from one representative replicate are presented in the fluorescence intensity histograms. (D) CD4+ T-cell proliferation after 5 days of coculture with Mtb or BCG-infected Mø. Following 24 h of the infection, CFSE stained CD4+ T-cells were added to the infected Mø culture. After 5 days of coculture, CD4+ T-cells CFSE fluorescence was measured by flow cytometry. Values in bar plots represent the proliferation index (average number of divisions per cell) of CD4+ T-cell (*P < 0.01, relatively to control). Histograms from one representative replicate of the different treatments infected with Mtb are presented in the bottom. The green areas represent the CD4+ T-cell populations after each division as modeled by the software. (E) IFN-γ was quantified in the supernatant after 5 days of cocultures of Mø with CD4+T-lymphocytes by ELISA. Values depict mean concentration of three biological replicates from one representative experiment performed in duplicate. Error bars depict the standard deviation (**P < 0.01; ***P < 0.001, relatively to control).

