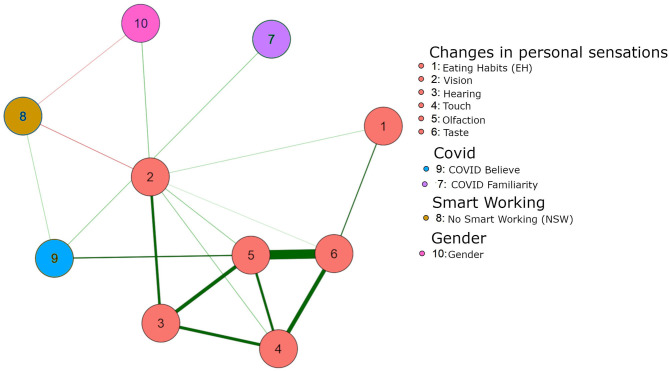
Figure 2.
Green lines indicate positive associations. Red lines indicate negative associations. Edges represent the direct association between two edges. The nodes indicate the variables as follow: 1 Eating Habits (EH); 2 Vision; 3 Hearing; 4 Touch; 5 Olfaction; 6 Taste; 7 Covid F; 8 NSW; 9 Covid B; 10 Gender.

