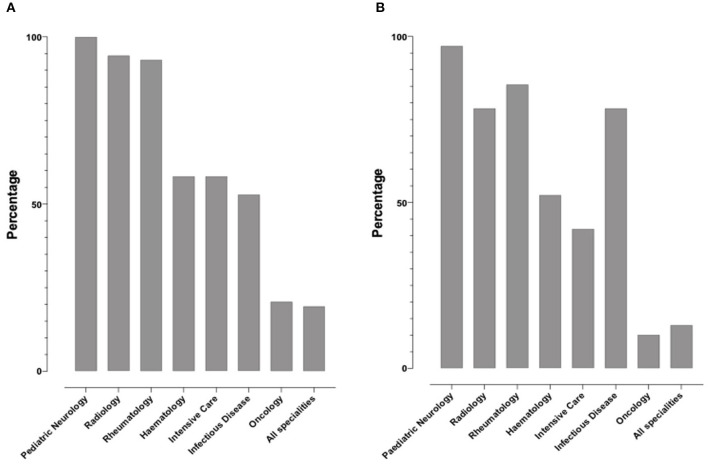
Figure 3.
Percentage of specialties respondents indicated should involve in the treatment of the two cases. (A) Bar chart illustrating the percentage of respondents who have indicated which specialties should be involved in Case 1, (B) Respondents were also asked to indicated which specialties should be involved in treating Case 2.

