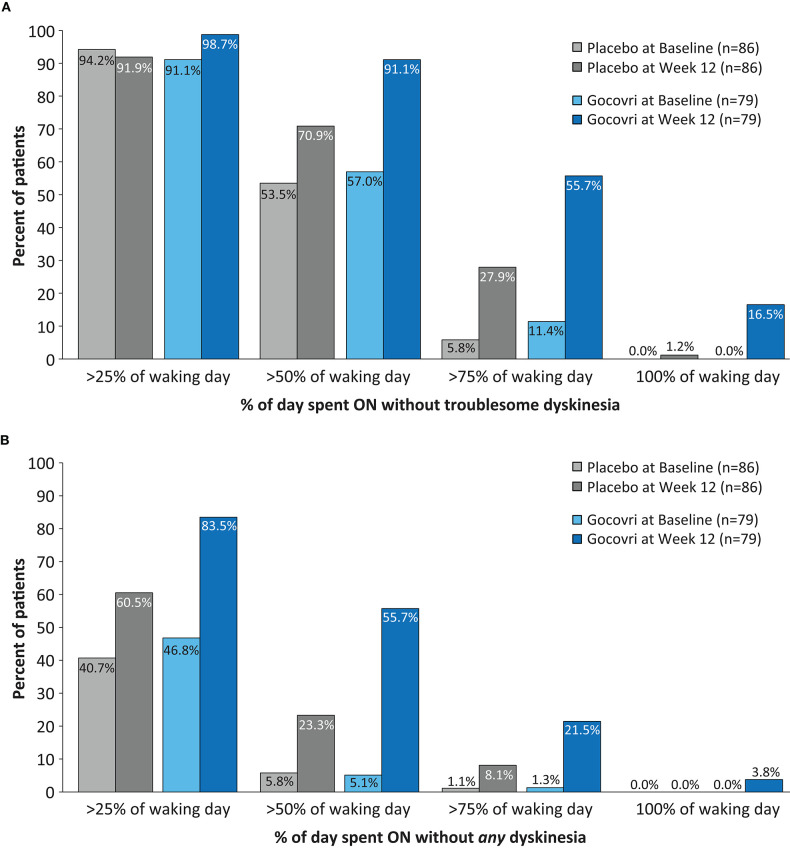
Figure 3.
Proportions of subjects at Baseline and at Week 12 achieving >25, >50, >75, and >100% of time during the Waking Day (A) ON without troublesome dyskinesia (p < 0.001 favoring Gocovri vs. placebo) (B) ON without (troublesome or non-troublesome) dyskinesia. (p = 0.003 favoring Gocovri vs. placebo). Two-sided p-values comparing Gocovri vs. placebo in terms of the frequency distribution of shifts from baseline to week 12 (where each shift was categorized in one of nine ordered classes representing levels of improvement, worsening, or no change, were obtained using the Cochran-Mantel-Haenszel chi-squared test. The frequency distribution for the shifts was determined by using the cross-classification of subjects at baseline and at week 12 with % of time of 25, 50, 75 and 100%. The baselines for all subjects [N = 96 placebo and N = 100 Gocovri] were: A) >25%: 94.8% and 93.0%; >50%: 55.2% and 57%; >75%: 6.3% and 12.0%; 100% none B) >25%: 40.6% and 46.0%; >50%: 6.3% and 5.0%; >75%: 1% and 1%; 100% none.

