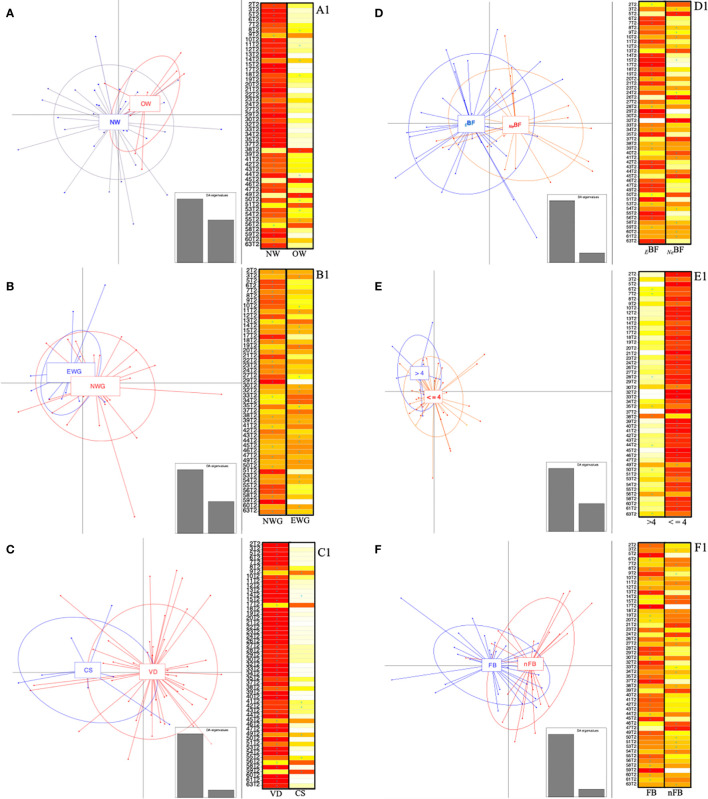
Figure 6.
Discriminant analysis of principal components (DAPC) and relative score-plots. (A–F) report the DAPC score plots based on the relative abundances (16S rRNA gene amplicon) of genera with median values >0.1% found in infants at 6 months. Panel: (A) NW, normal BMI (<25 kg/m2); OW, women overweight/obesity (BMI ≥ 25 kg/m2); (B) NWG, optimal weight gain; EWG, excessive weight gain; (C) VD, vaginally delivered; CS, delivered by cesarean section; (D) BF, exclusive breast-feeding; FF, combined or exclusive formula-feeding; (E) ≤4, infants weaned before 4 months of age; >4, infants weaned after 4 months of age. Panel (F) FB, first-born; nFB, not first-born. (A1–F1) respectively indicate whether the infants (rows) could be assigned based on discriminant functions by K-means analysis. The cell colors represent the membership probabilities (K-means analysis) to belong to each cluster (red = 1, orange = 0.75, yellow = 0.25, white = 0) and blue crosses indicate the originally belonging cluster.

