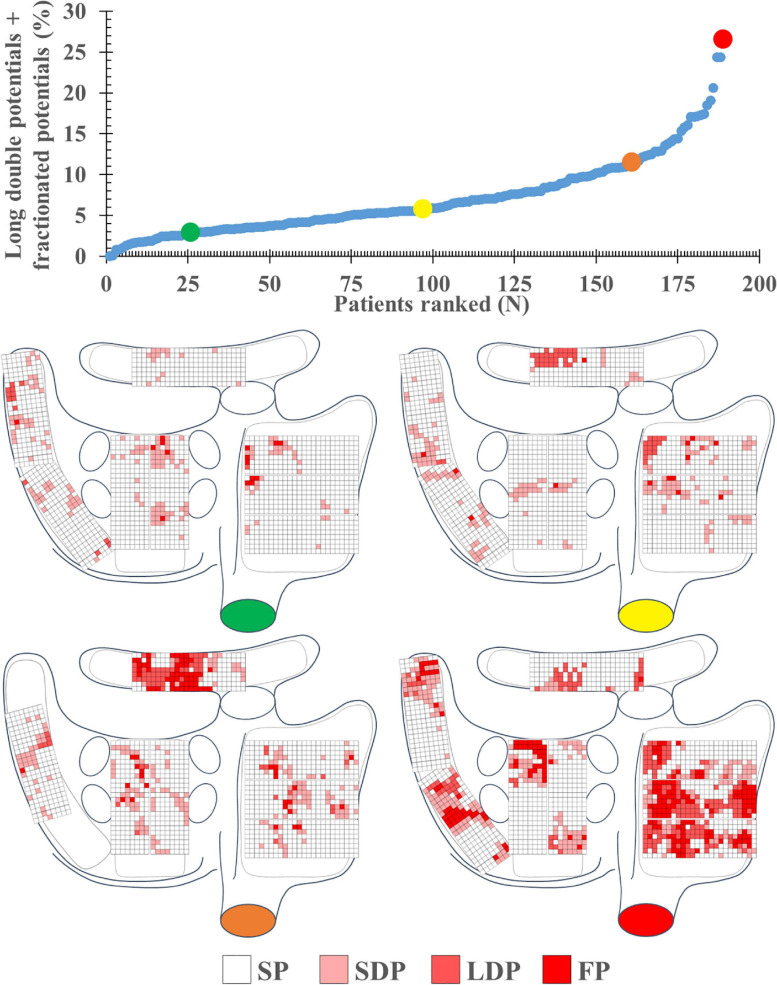
FIGURE 2.
The upper left panel shows the proportion of long double and fractionated potentials for each individual patient; patients are ranked according to an increase in fractionation. The lower panel demonstrates typical examples of color-coded signal maps from four different patients, showing the proportion of the different EGM types at the various recording sites. These maps correspond to the patients marked in the graph by colored dots (green, yellow, orange, and red). FP, fractionated potential; EGM, electrogram; LDP, long double potential; SDP, short double potential; SP, single potential.

