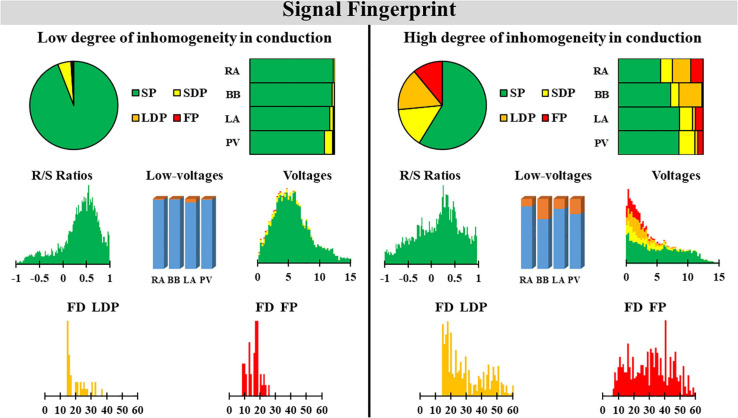
FIGURE 7.
Two examples of a signal fingerprint obtained from one patient with a low and one with a high degree of inhomogeneity in conduction. The upper panels show the distribution of potential types of the entire (left, pie plot) and for each region separately (right, stacked bars). The middle left plot shows the R/S ratio distribution of all SPs of the entire atrium. The middle center bar plot displays the number of low-voltage potentials plotted for each region separately. The middle right plot shows the distribution of voltages (mV) of SPs (green), SDPs (yellow), LDPs (orange), and FPs (red) from all atrial regions. The lower panel displays the distribution of fractionation duration (ms) for LDPs (left) and FPs (right). SP, single potential; SDP, short double potential; LDP, long double potential; FP, fractionated potential; FD, fractionation duration.

